Gaming on Android devices
Mobile Gaming: Just A Quick Fix?
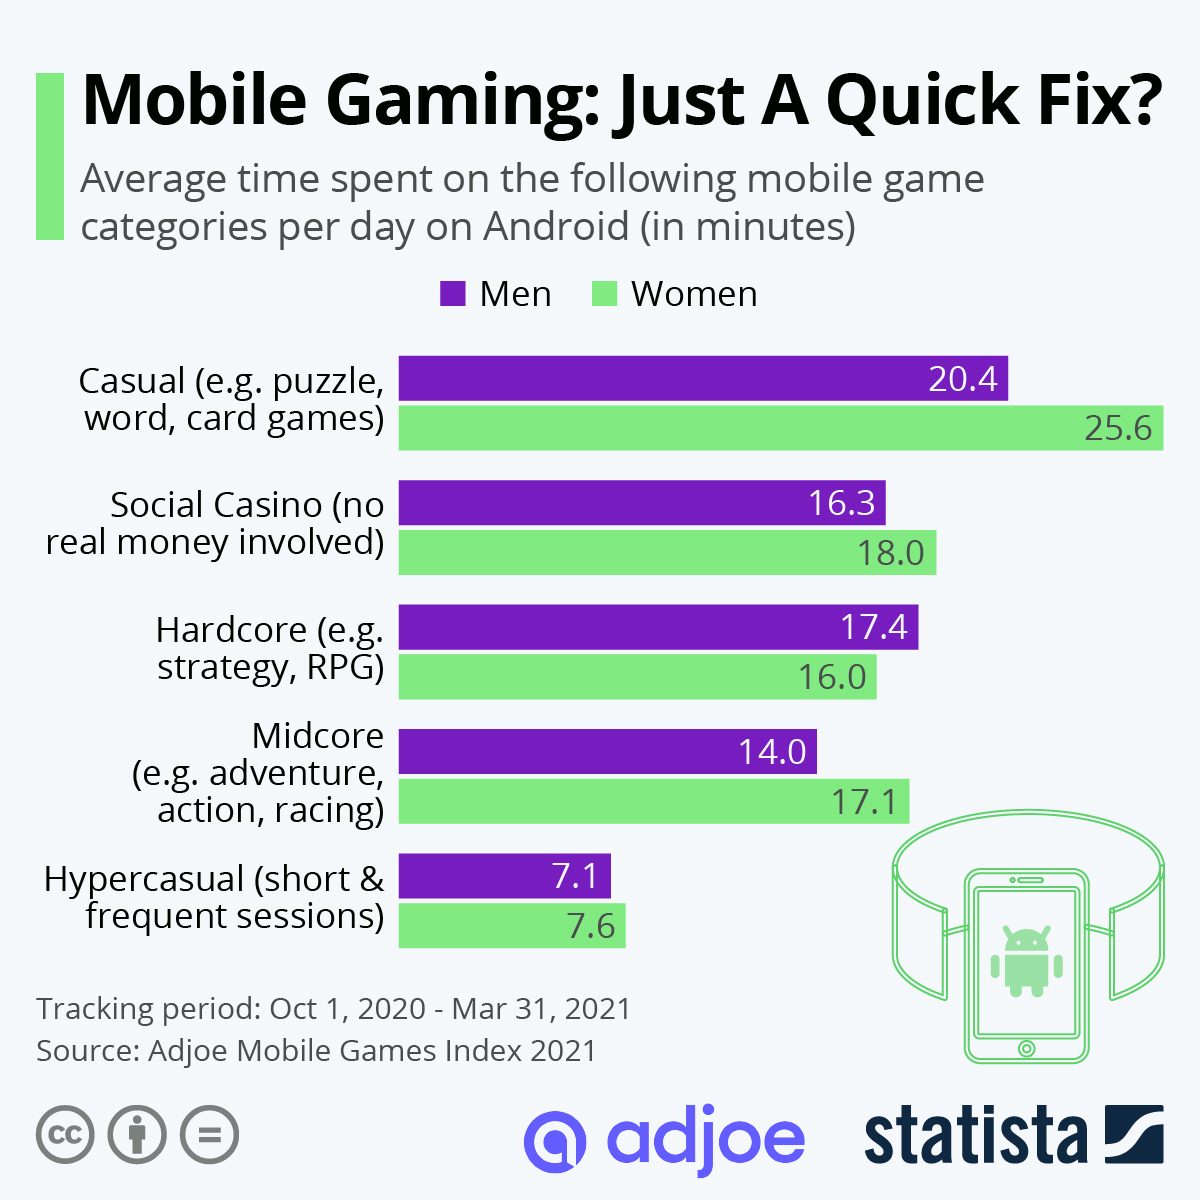
On average, male Android users play 20.4 minutes of casual games per day, while female Android users get their casual gaming fix from approximately 25.6 minutes spent gaming on their mobile phones or tablets. According to data aggregated by Adjoe, this makes the gaming segment home to successful titles like Yahtzee, Parchisi STAR or Paint By Number the number one most popular mobile game category worldwide. As our chart shows, the lower ranks have some surprises in store.
The hardcore category, which consists of strategy and role-playing games, comes in third with men spending 17.4 minutes and women spending 16 minutes on average each day playing titles like Shadow Fight 3, Hero Wars or RAID: Shadow Legends. Due to the titles being based on a free-to-play model with in-app purchases and generally being less complex than most traditional video games, they can't be compared to big budget franchises catering to the PC and console gaming crowd like Grand Theft Auto, FIFA or Assassin's Creed, of course.
Taking an even more simplified approach are the so-called hyper-casual games such as Idle Arks or Chain Cube which are often categorized by short, but frequent sessions. Adjoe data shows that female Android users spent an average of 7.6 minutes per day on these kinds of games, while their male counterparts invested 7.1 minutes per day.
Mobile games are often looked down upon, but this segment of the video game market nonetheless generates the most revenue by a considerable margin. In 2020, the gaming industry generated approximately $134 billion in revenue according to the Statista Digital Market Outlook, with mobile games alone accounting for $93 billion. The three biggest markets in the world are China, the U.S. and Japan with revenues of $42 billion, $27 billion and $18 billion, respectively.

Description
This chart shows the average time per day spent on mobile games on Android.
Any more questions?
Get in touch with us quickly and easily.
We are happy to help!
Statista Content & Design
Need infographics, animated videos, presentations, data research or social media charts?