Bicycle Market
Cycling Has Shifted to a Higher Gear During Covid-19
Commemorated on June 3 each year, World Bicycle Day is celebrated to promote the benefits of cycling and recognize its importance as a simple, affordable and environmentally friendly mode of transportation. The United Nations declared this observance in April 2018 to highlight the bicycle's role in fostering sustainable development, health and well-being, encouraging governments and societies to embrace cycling as a means to reduce pollution and enhance the quality of life in urban and rural areas alike.
In the United States, a firmly car-centric society, the bicycle plays a relatively minor role compared to large parts of Europe, where people are much more likely to rely on their bikes for everyday transportation. During the Covid-19 pandemic, however, which forced gyms to shutter and public transportation to suspend operations, millions of Americans re-discovered bicycles as a safe, socially-distanced form of physical exercise and transportation. The bike boom hit retailers unprepared, causing new bicycles to become a scarce commodity, exacerbated by the fact that global bicycle supply was also constrained due to Covid-19.
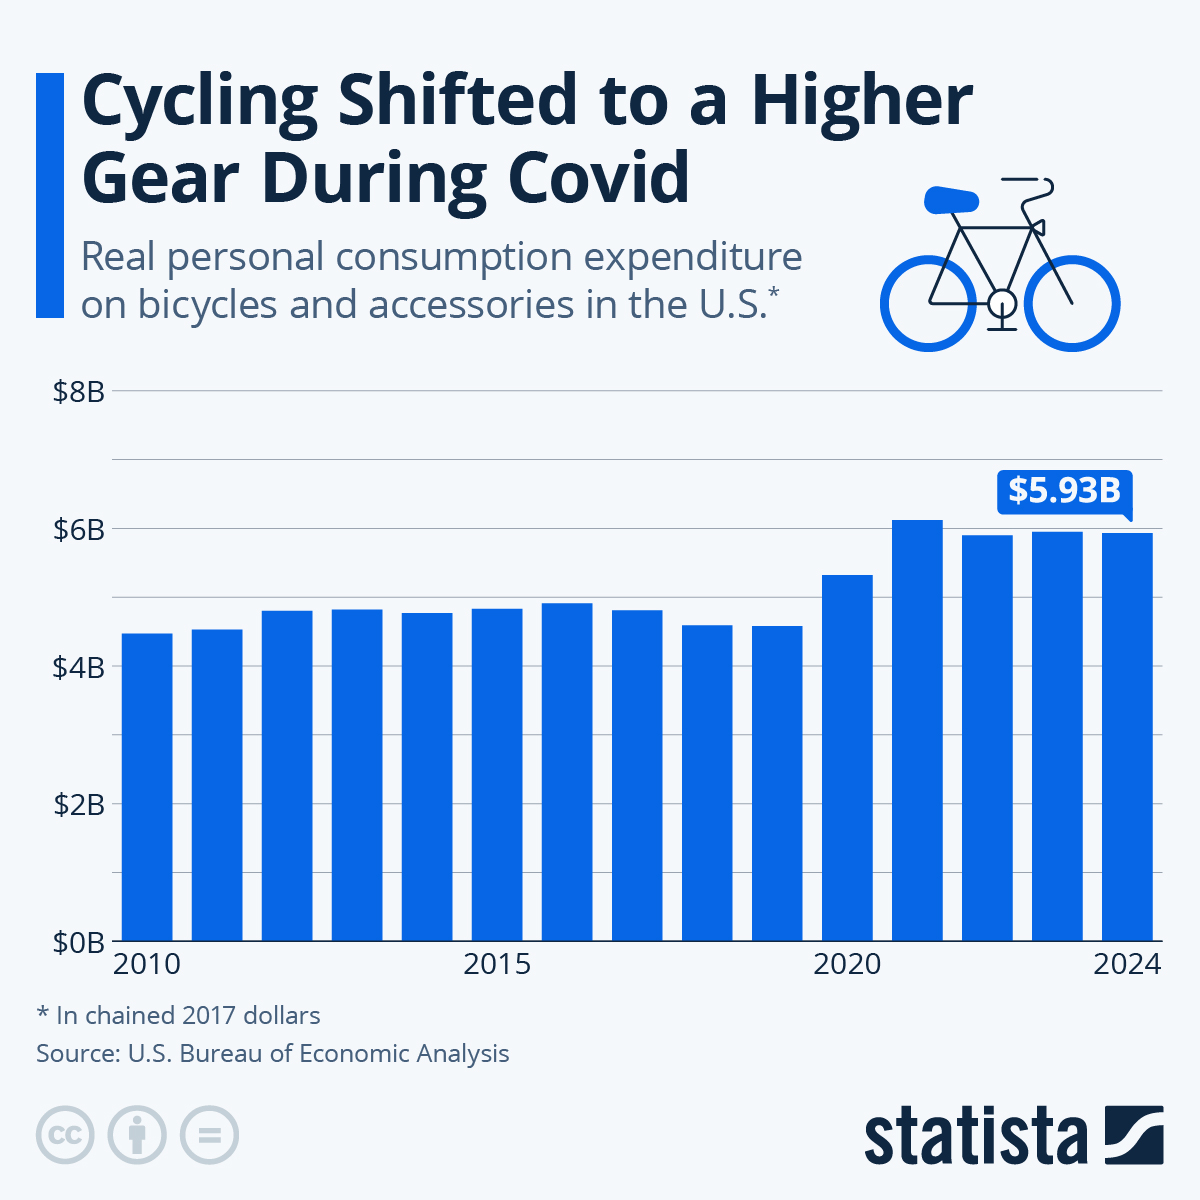
According to inflation-adjusted figures published by the U.S. Bureau of Economic Analysis, Americans spent $5.3 billion on bicycles and accessories in 2020, up from an average of $4.7 billion between 2015 and 2019. The trend continued in 2021, when consumer spending on bicycles and accessories grew past $6 billion, surpassing the pre-pandemic average by almost 30 percent. Looking at the past two years, consumer spending on bicycle gear has plateaued at that level, fueling hopes that the industry could remain in a higher gear compared to pre-Covid days.

Description
This chart shows real personal consumption expenditure on bicycles and accessories in the U.S.
Related Infographics
Any more questions?
Get in touch with us quickly and easily.
We are happy to help!
Statista Content & Design
Need infographics, animated videos, presentations, data research or social media charts?


