Emissions
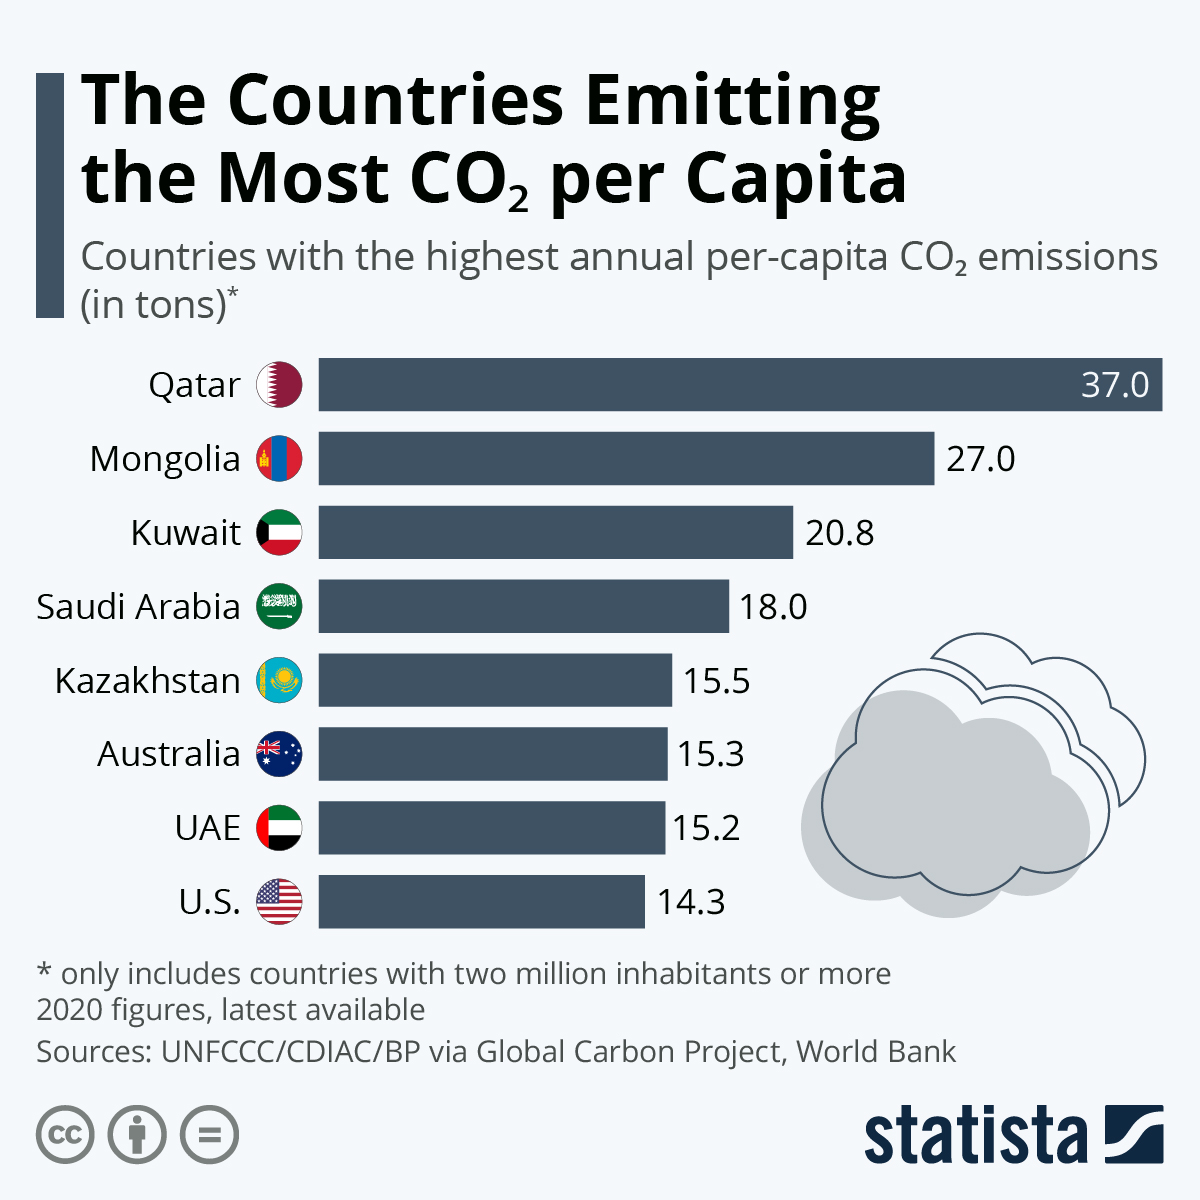
The Countries Emitting the Most CO₂ Per Capita
Big countries with large populations – above all China, the U.S. and India, emit the most CO₂ in total, but countries on the Arabian Peninsular are ahead of almost anybody else when it comes to emitting the most CO₂ per capita.
According to data published by the Global Carbon project, Qataris – even though they are few in numbers – were the worst per-capita polluters, followed by the inhabitants of Kuwait in rank 3 and Saudi Arabia in rank 4. The chart doesn't consider countries with fewer than two million inhabitants but if it would, Bahrainis would also make the top 10.
Mongolia - a country heavily dependent on coal - squeezes into second rank. Australians, U.S. Americans and Canadians (in rank 9) are the biggest polluters of the Western world.
While on the Gulf, the cheap availability of oil is upping per-capita CO₂ pollution levels, in the case of developed Western nations, it is the reliance on cars as a means transportation and the burning of coal for electricity that drive up emissions.
Other than Bahrain, small island nations like Trinidad and Tobago or Curaçao, are also emitted from the chart. There, per-capita emissions are also quite high but this is usually the result of tourism and/or the necessity to fly to leave the island.
The emitting of CO₂ into the air is one of the main causes of global warming. The concentration of CO₂ in the global atmosphere remained relatively stable until the industrial revolution at around 200 particles per million. From the 19th century onward, its density multiplied rapidly, reaching 419 particles per million most recently.

Description
This chart shows the countries with the highest annual CO₂ emissions per capita in 2020 (two million inhabitants or larger).
Related Infographics
Any more questions?
Get in touch with us quickly and easily.
We are happy to help!
Statista Content & Design
Need infographics, animated videos, presentations, data research or social media charts?


