Minimum Wage
A Brief History of the U.S. Minimum Wage
The House of Representatives is scheduled to vote on the Raise the Wage Act on Thursday. The bill, introduced by House Democrats in January, aims to gradually raise the federal minimum wage to $15 by 2025, more than doubling it from the current rate of $7.25.
While experts consider the bill likely to pass in the Democratic-led House, it would have to pass the Republican Senate and the President’s desk to be signed into law, both of which looks very unlikely at this point.
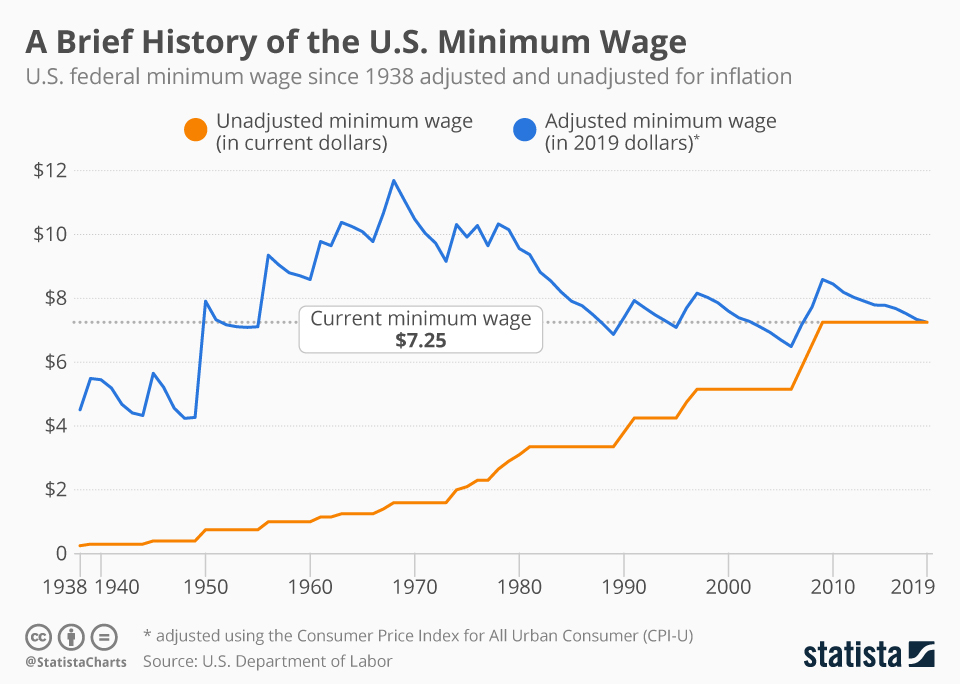
While the minimum wage may not be raised to $15 in the near future, a more moderate hike seems slightly more likely. After all, it has been unchanged since 2009 – the longest period of standstill since its introduction in 1938. Adjusted for inflation, the minimum wage has been above the current rate for large parts of the 20th century, with 1968 marking the peak. Back then, the minimum hourly earnings for U.S. workers amounted to $11.69 in 2019 dollars.

Description
This chart shows how the U.S. minimum wage has developed since its introduction in 1938.
Related Infographics
Any more questions?
Get in touch with us quickly and easily.
We are happy to help!
Statista Content & Design
Need infographics, animated videos, presentations, data research or social media charts?


