Consumer Price Index
Inflation Cools to Four-Year Low but Tariff Impact Looms
Inflation in the U.S. moderated more than expected in March, as both headline inflation and the core index excluding more volatile food and energy prices fell to their lowest levels since early 2021. According to data published by the Bureau of Labor Statistics on Thursday, the Consumer Price Index for All Urban Consumers (CPI-U) increased 2.4 percent over the last 12 months before seasonal adjustment, a significant deceleration from 3.0 and 2.8 percent in January and February, respectively. The core index fell to 2.8 percent in March, the first time it dropped below 3 percent since March 2021.
While the decline in the headline inflation figure was partly driven by an almost 10-percent drop in gas prices, core inflation cooled thanks to a moderation in shelter prices, which increased 4.0 percent year-over-year in March - the slowest increase since November 2021. Due to its weight in the Consumer Price Index - shelter is by far the largest expenditure category in the virtual goods basket - housing costs have been a major contributor to inflation over the past year. Excluding the impact of shelter, inflation would been at or below the Fed's target level of 2 percent in 18 of the past 22 months, illustrating that housing costs have been the most stubborn driver of elevated inflation lately.
While President Trump already called for more rate cuts ahead of Thursday's CPI report, it's unlikely that the Fed will make any moves before its next regularly scheduled meeting in May. After all, the relief offered by the latest inflation reading could very well be short-lived. Experts are all but certain that the blanket tariffs announced over the past few weeks will have a significant impact on consumer prices in the United States - an effect that we'll likely begin seeing in the data for April.
According to the CME FedWatch Tool, there's currently a 75-percent chance that the Fed will keep its policy rate unchanged in May but a 66 percent chance of a 25 basis point cut in June.
Description
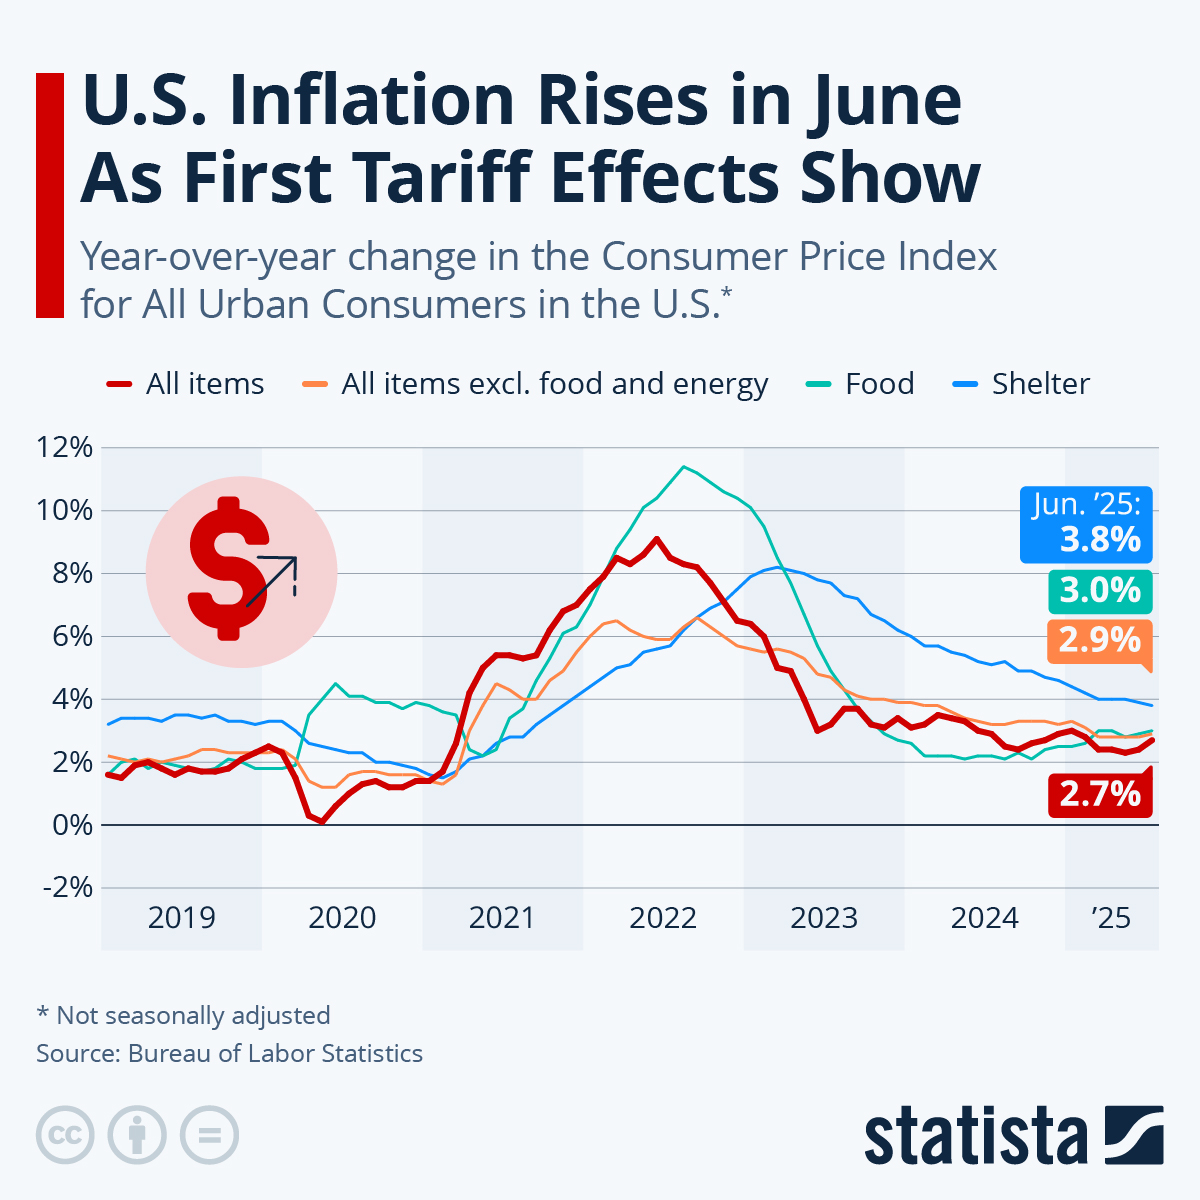
This chart shows the year-over-year change in the Consumer Price Index for All Urban Consumers in the U.S.
Any more questions?
Get in touch with us quickly and easily.
We are happy to help!
Statista Content & Design
Need infographics, animated videos, presentations, data research or social media charts?