Now that the first two months of 2013 have passed, it's time to take a look at how some high-profile U.S. technology companies have performed in the stock market so far this year.
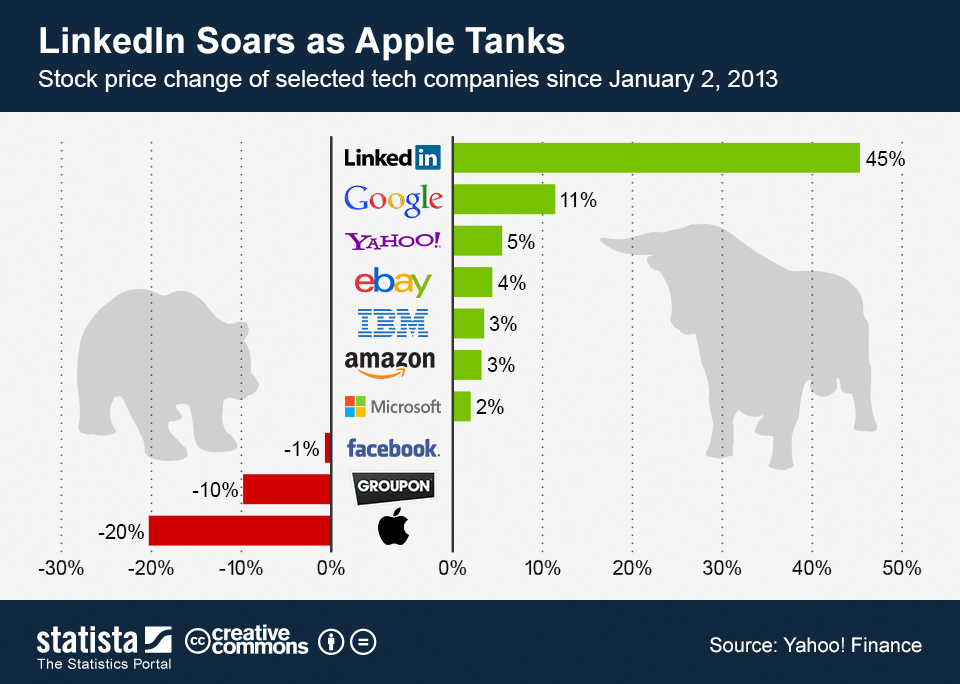
The clear winner thus far is LinkedIn. The social network for business professionals continued its run from 2012 and soared 45 percent since January 2. Backed by great results, analysts are very positive about LinkedIn's business and investors apparently share their optimistic outlook.
The other obvious winner of 2013 is Google. The company continues to dominate the search market, delivers good results and creates positive press with innovative products such as Google Glass. Google's stock price climbed more than 10 percent since January, bringing the company's market cap to $264 billion.
On the other end of the spectrum is Apple, a company that used to be a Wall Street darling for the better part of the past ten years. Apple's stock price dropped 10 percent since January and almost 40 percent since hitting its all-time high in September 2012. Even though the company is still remarkably profitable, it is surrounded by negative sentiment and desperately needs a win to turn the momentum back in its favor.
The second loser of 2013 is Groupon. The company's stock had just partly recovered from a terrible run in 2012, when a disappointing earnings report sent the stock sliding again. As a consequence, Groupon's CEO Andrew Mason was fired, a decision that was received positively on Wall Street.
LinkedIn Soars as Apple Tanks

Description
This chart shows the stock price change of selected tech companies since January 2, 2013.


