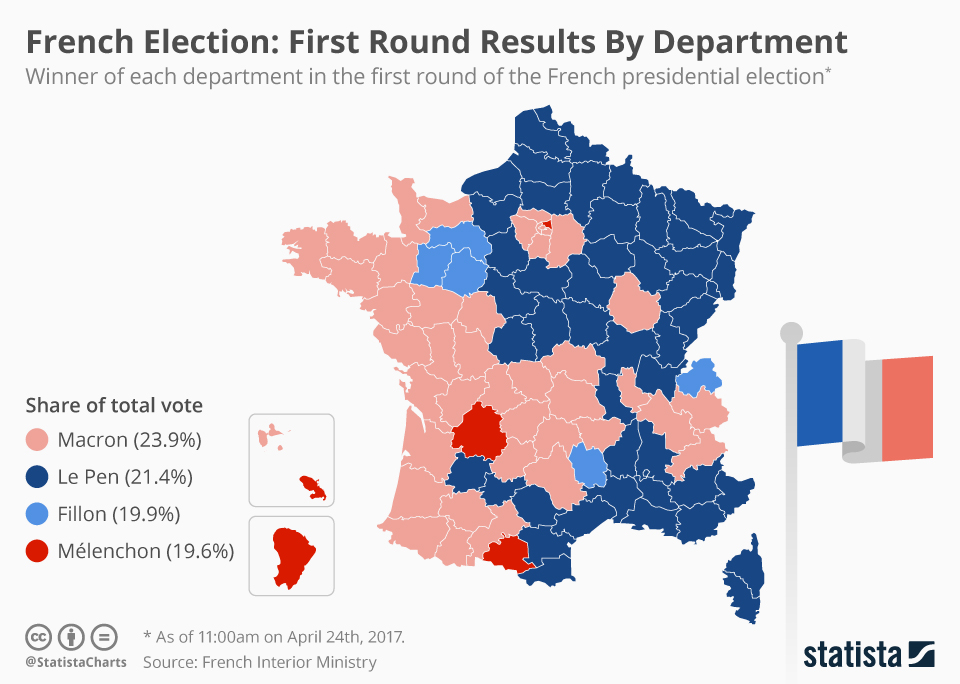
As predicted, centrist Emmanuel Macron and far-right leader Marine Le Pen have both progressed to the second round of the French presidential election. Macron won 23.8 percent of the vote while Le Pen had 21.5 percent. The following map shows how both candidates performed on a regional basis and it shows that France is experiencing a political fracturing between the big cities and the countryside.
Voters in Paris rejected Le Pen with the FN leader picking up just 4.99 percent of the capital's votes compared to Macron's 34.83 percent. However, she did prove extremely popular with rural voters and in the five regions surrounding Paris in particular. Le Pen also came first in Grand Est, Hauts-de-France, Normandie, Centre-Val de Loire and Bourgogne-Franche-Comté. Despite her popularity outside the country's big cities, Le Pen is still expected to lose to Macron in the second round of the election on May 07.
French Election: First Round Results By Department
French Election

Description
This chart shows the winner of each department in the first round of the French presidential election.


