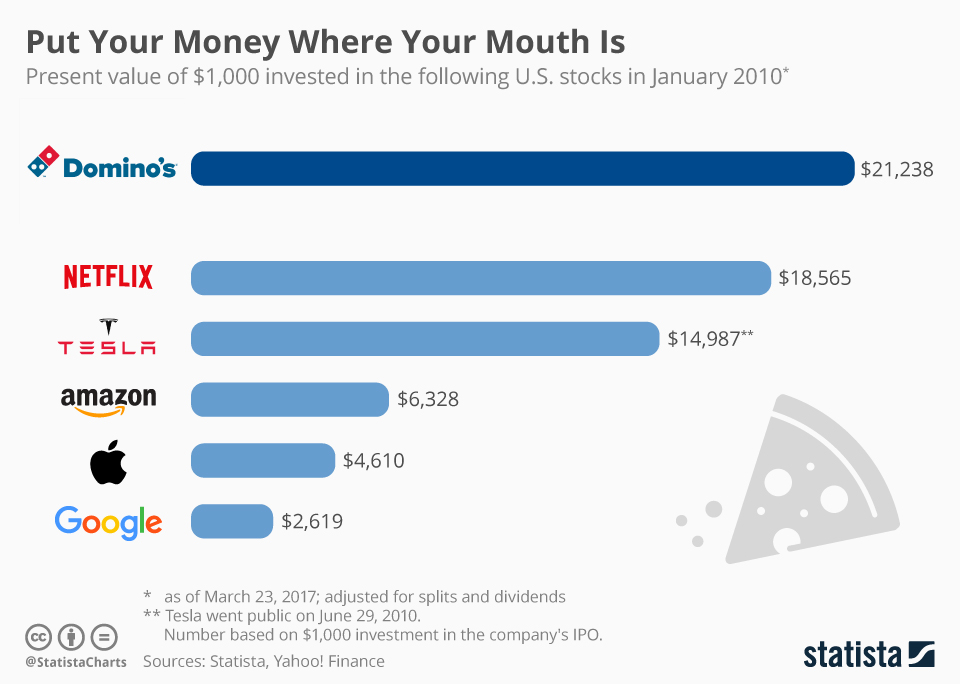
If you had some money on your hands in 2010 and decided to put it into a savings account, you probably asked yourself more than once: what if? What if you had taken the money and invested in one of those highly successful tech companies instead? Be it industry heavyweights such as Google, Amazon and Apple or slightly smaller, category-leading players such as Netflix and Tesla, they all treated their shareholders to healthy returns over the past few years. Had you invested $1,000 in any of these companies in January 2010, your investment would have at least doubled by now, in most cases it would be worth several times your initial investment.
Well, here’s another what if. What if you had literally put your money where your mouth is and invested in Domino’s Pizza instead? (Not the actual pizza but the company behind it.) In that case, you would be looking at a return of more than $20,000 right now, happy that your love of pizza finally left you with more than a guilty conscience.
So what happened that made Domino’s outperform some of the most successful companies in the U.S. this decade and earn the company a $9 billion valuation? Well, it appears as if Domino’s quite literally found the recipe for success in 2009, when it changed the fundamental ingredients of its pizza in late December. Since then, the company’s stock price rose by more than 2,000 percent. In 2016, the company made a profit of $215 million on $2.5 billion in revenue.
Forget Tech Stocks! You Should Have Invested in Pizza
Domino's Pizza

Description
This chart shows how much a $1,000 investment in selected U.S. companies' shares would be worth today.


