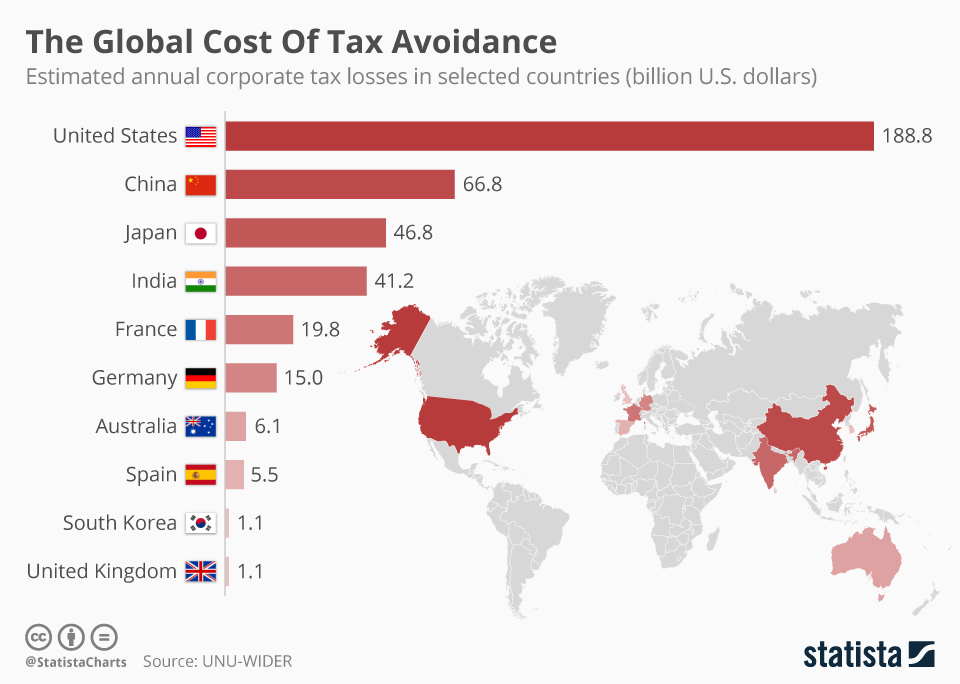
Every year, the world's economies lose billions of dollars to tax avoidance. Estimates of the sheer scale of the losses fluctuate wildly with the IMF reporting that around $600 billion is lost due to profit shifting every year. A new paper published by UNU-WIDER took a closer look at the issue at country level, finding that the United States loses the highest amount in absolute terms by far.
Every year, the U.S. loses an estimated $189 in corporate tax, around 1.13 percent of GDP. China has the second highest annual losses in absolute terms with $66.8 billion while Japan is also badly effected with $47 billion unaccounted for. The IMF has reported that OECD countries lose approximately 2 to 3 percent of their total annual tax revenue while lower-income countries lose substiantially more. That trend can be seen by taking Chad as an example.
The paper estimated that the central African nation loses $950 million in tax revenue every year. Even though that might seem insignificant compared to other countries, those losses have a far-reaching impact equating to around 7 percent of Chad's GDP.
The Global Cost Of Tax Avoidance
Tax Avoidance

Description
This chart shows estimated annua corporate tax losses in selected countries (billion U.S. dollars).


