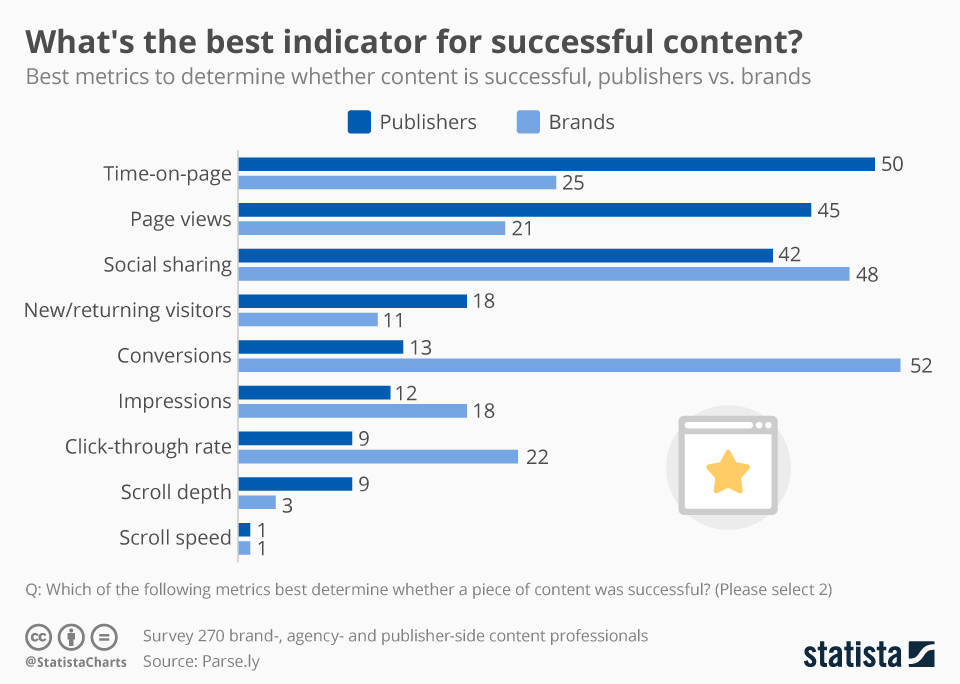
It’s notoriously hard to measure successful content in the online world. There are many different metrics out there that could possibly tell you if the things you put online are being accepted by users. Among publishers there are three main yardsticks that, according to Parse.ly, are the most important: amount of time users spend on respective pages, page views, but also social sharing.
Brands agree that social sharing is very important, but other than that count conversions as the single most important metric. That’s when you got the user hooked. This of course has to do with the different product types: While publishers seek to maximise their audience on page, for brands online content is more of a means to an end, serving as bait to transform users into consumers.
Related Infographics
FAQ
- The Statista "Chart of the Day", made available under the Creative Commons License CC BY-ND 3.0, may be used and displayed without charge by all commercial and non-commercial websites. Use is, however, only permitted with proper attribution to Statista. When publishing one of these graphics, please include a backlink to the respective infographic URL. More Information
- The Statista "Chart of the Day" currently focuses on two sectors: "Media and Technology", updated daily and featuring the latest statistics from the media, internet, telecommunications and consumer electronics industries; and "Economy and Society", which current data from the United States and around the world relating to economic and political issues as well as sports and entertainment.
- For individual content and infographics in your Corporate Design, please visit our agency website www.statista.design
Any more questions?
Get in touch with us quickly and easily.
We are happy to help!
Do you still have questions?
Feel free to contact us anytime using our contact form or visit our FAQ page.
Your contact to the Infographics Newsroom
Statista Content & Design
Need infographics, animated videos, presentations, data research or social media charts?