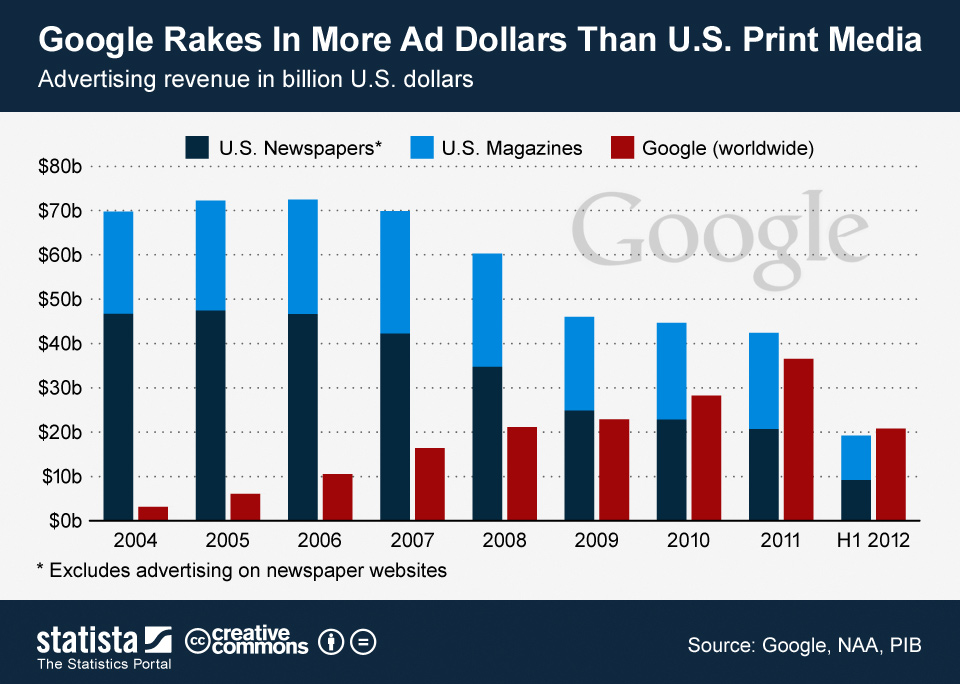
Over the past few years, online ads have quickly grown past newspaper and magazine advertising to become the second largest ad medium behind television.
We have played with the numbers a little bit and found an interesting piece of information that nicely illustrates how ad markets have changed in the past decade: in the first six months of 2012, Google raked in $20.8 billion in ad revenue, while the whole U.S. print media (newspapers and magazines) generated $19.2 billion from print advertising. That is, Google, a company founded 14 years ago, makes more money from advertising than an industry that has been around for more than a hundred years.
Given the fact that Google operates globally, the comparison is obviously unfair and shouldn’t be judged scientifically, but nonetheless it shows how big Google’s ad business really is and how small print advertising has become.
Note: We have been made aware of the fact that Google's revenue figures represent gross revenue, i.e. revenue before payments to publishers. According to Google, the company paid around $4 billion to publishers in the first six months of 2012.
Google Rakes In More Ad Dollars Than U.S. Print Media

Description
This chart shows Google's advertising revenue since 2004 compared to print ad revenues of U.S. newspapers and magazines.


