While everybody was still going on about Apple’s „disappointing“ June quarter, social gaming company Zynga posted results that were in fact disappointing. Zynga reported underwhelming growth and cut its full year EPS forecast to a range of $0.09 - $0.04, widely missing Wall Street expectations of $0.27.
Trying to explain his company’s weak performance CEO Mark Pincus quoted changes that Facebook had made to its gaming platform and weaker-than-hoped performance of $200 million acquisition Draw Something.
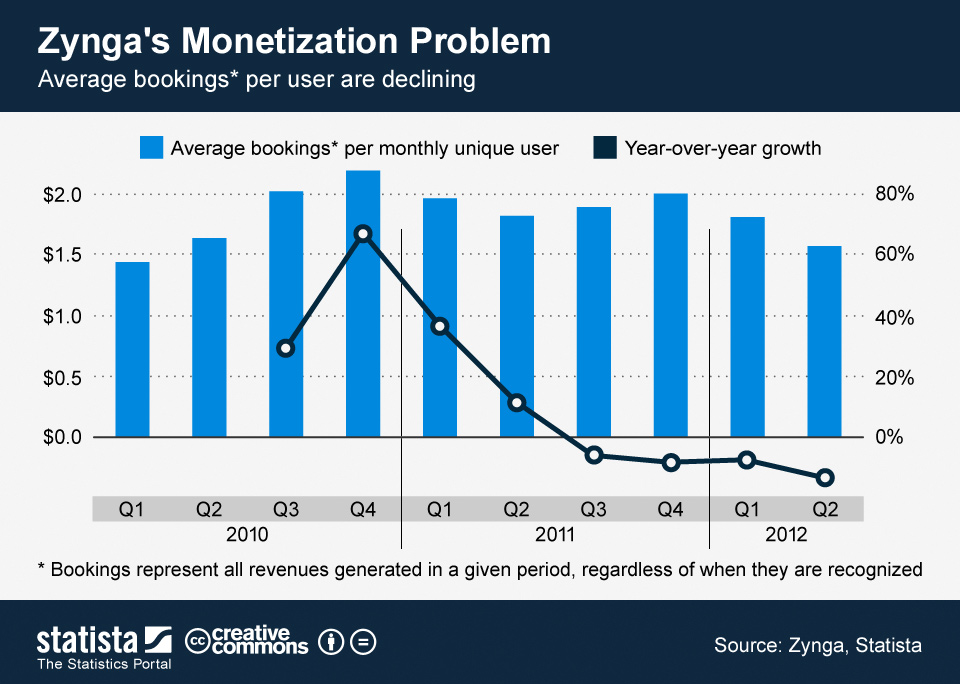
After crunching the numbers, we found that Zynga is still having trouble monetizing its ever-growing user base. Average bookings per monthly unique user are on a downward-slope, having declined year-over-year in each of the past four quarters. If Zynga doesn’t manage to turn this trend around, the company will have trouble justifying the hype that surrounded its IPO last year.
Zynga's Monetization Problem

Description
This chart illustrates that Zynga's average bookings per monthly unique user are on a downward-slope, having declined year-over-year in each of the past four quarters.


