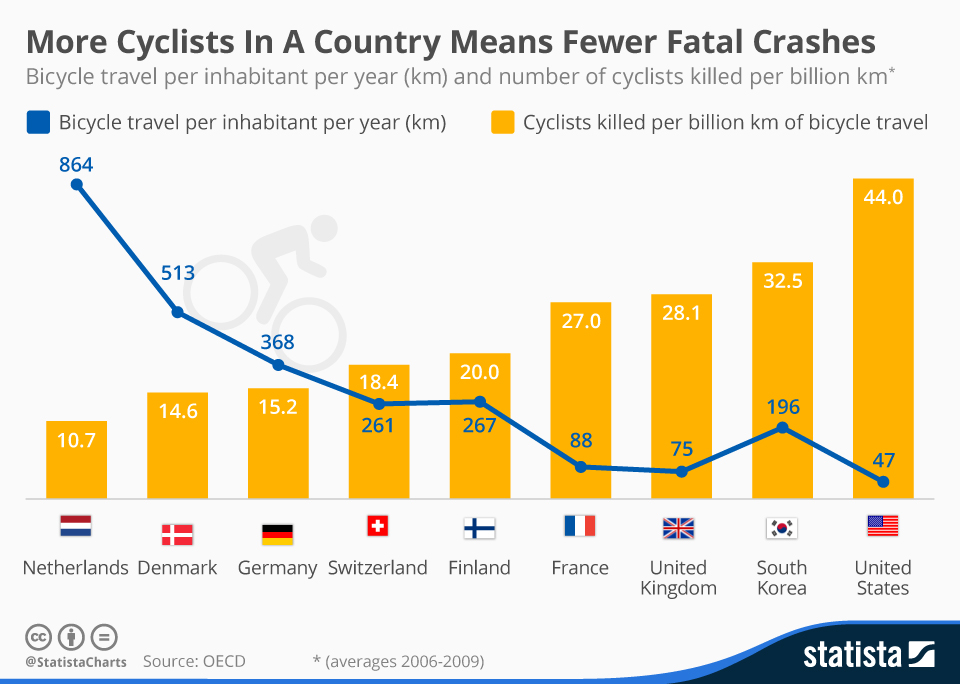
Deaths among cyclists in the United States are trending upwards as commuting rises, increasing from 621 in 2010 to 722 in 2012. However, an OECD report suggests that the more cyclists a country has, the fewer fatalities it will tend to experience. Why? In an environment where bicycles and the infrastructure to support them are plentiful, awareness will be high. By contrast, a lone cyclist in a traffic choked urban environment is far more likely to end up in an accident, due to motorists who may not be aware/used to his or her presence.
Why then has the number of deaths among American cyclists increased in line with more people commuting to work via bicycle? Unfortunately, according to the OECD report, the "safety in numbers" effect as it has come to be known involves a degree of uncertainty. Both motorists and cyclists need time to adapt to each other's presence. This means that a rapid increase in bicycles may result in more accidents in the short term until awareness kicks in over a longer time period and the safety level improves.
More Cyclists In A Country Means Fewer Fatal Crashes

Description
This chart shows bicycle travel per inhabitant per year (km) and number of cyclists killed per billion km.


