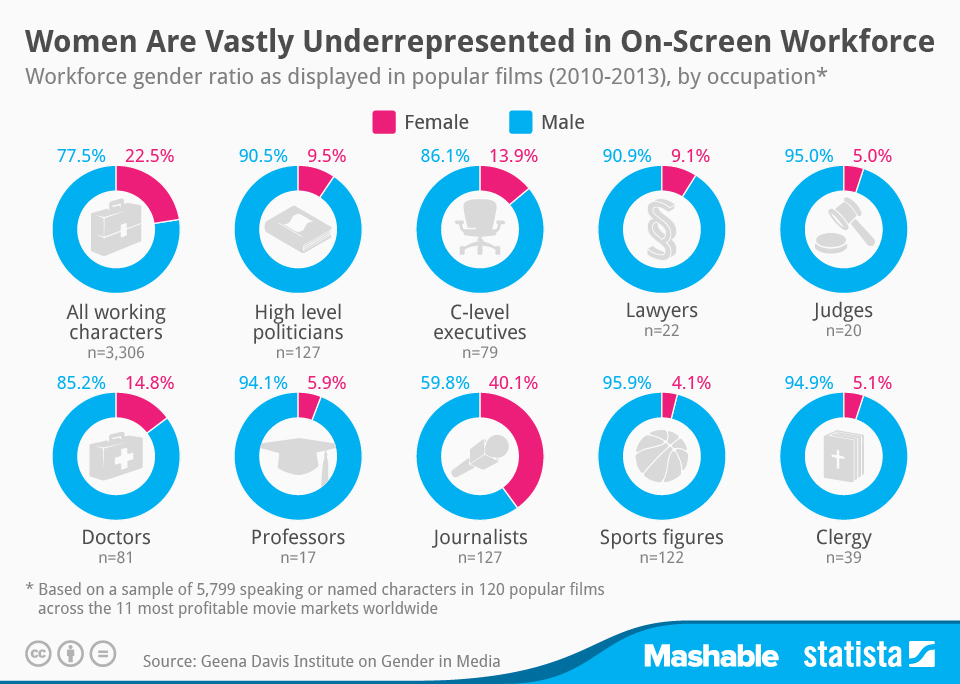
The Geena Davis Institute on Gender in Media published a UN-backed report on gender images in films this week. The report is based on an analysis of 120 films across the most profitable movie markets in the world, including the United States, China and India among others. Covering several aspects of gender portrayal in movies, the key takeaway from the report is that the film industry perpetuates inequalities by using stereotypes, sexualizing female characters and rarely showing women in powerful positions.
Our chart illustrates the results of the report regarding the portrayal of females in the on-screen working world. It shows that women are vastly underrepresented in the fictitious workforce and that female characters in prestigious occupations are a rarety in movies. Of the 3,306 fictional characters working a job across the sampled films, only 22.5% were female. Considering that women comprise 39.8% of the global workforce in the real world, it seems fair to say that the film industry does not adequately reflect the progress that has been made in terms of professional gender equality.
Women Are Vastly Underrepresented in On-Screen Workforce


