Campaign group Transport & Environment has released a ranking of Europe's worst polluters, finding that the Mediterranean Shipping Company's fleet has joined Ryanair on the list of the top-emitters, along with eight coal-fired power plant operators. It also found that ships sailing to and from Europe emitted over 139 million tonnes of CO2 last year. If the EU's shipping fleets were a country, they would be the EU's 8th largest emitter, just after the Netherlands. Meanwhile, the maritime sector is exempt from paying tax on its fuel under EU law which effectively acts as a subsidy worth €24 billion annually.
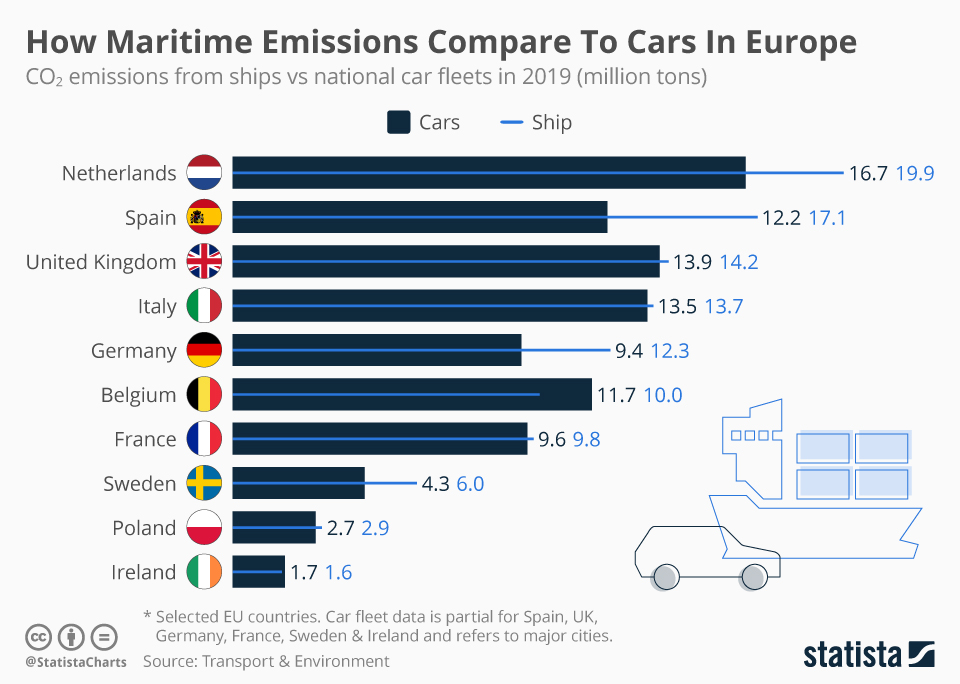
One way of gauging just how dirty Europe's ships are is by comparing those fleets to the total number of cars in different countries. It's important to mention that in some cases, the data for national cars is partial, taking only large cities into account rather than the entire country. For example, Germany only takes into account cars in the top-10 cities while Ireland only encompasses the cities of Dublin, Cork and Limerick.
In Belgium, which has a relatively short coastline, shipping emissions (10 million tonnes) come close to surpassing the country's entire fleet of cars (11.7 million tonnes). In the Netherlands, ships emit more CO2 than all cars combined across the country. The situation is similar in the UK, where maritime emissions are higher than automobile emissions in the 17 biggest UK cities.
How Maritime Emissions Compare To Cars In Europe
Maritime Emissions

Description
This chart shows CO2 from ships vs emissions from national car fleets in 2019 (million tons).


