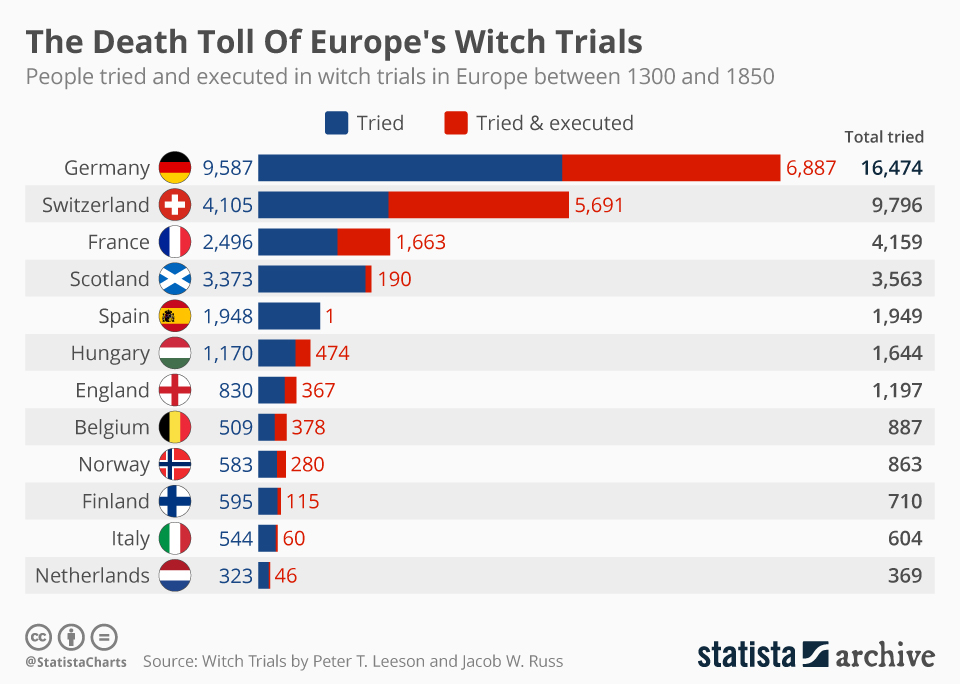
The terms "witch" and "witchcraft" are common in many cultures and societies across the world, inherently familiar to Americans in particular through Halloween and to a lesser extent, perhaps, the president's frequent "witch-hunt" tweets. The following Statista Archive infographic takes a closer look at the toll of real life witch-hunts that reached their zenith in the Early Modern period between 1450 and 1750 when witchcraft led to moral panic and mass hysteria.
Peter T. Leeson and Jacob W. Russ published "Witch Trials" in the Economic Journal and it provides an interesting overview of witch-trial activity across European countries between 1300 and 1850. The toll of trials and executions is now presented in the context of the continent's modern borders. During the above period, 16,474 people were put on trial for witchcraft in Germany and close to 7,000 were put to death.
Even though the notion of witch-hunts and trials may seem absurd today, contemporary witch-hunts have been reported in Sub-Saharan Africa and Papua New Guinea. Official legislation against witchcraft is still in place in Saudi Arabia and Cameroon today. In 2011, a woman was beheaded in Saudi Arabia for allegedly practicing witchcraft and sorcery, an event human rights organizations described as "extremely shocking".
The Death Toll Of Europe's Witch Trials
Witch Trials

Description
This chart shows people tried and executed in witch trials in Europe between 1300 and 1850.


