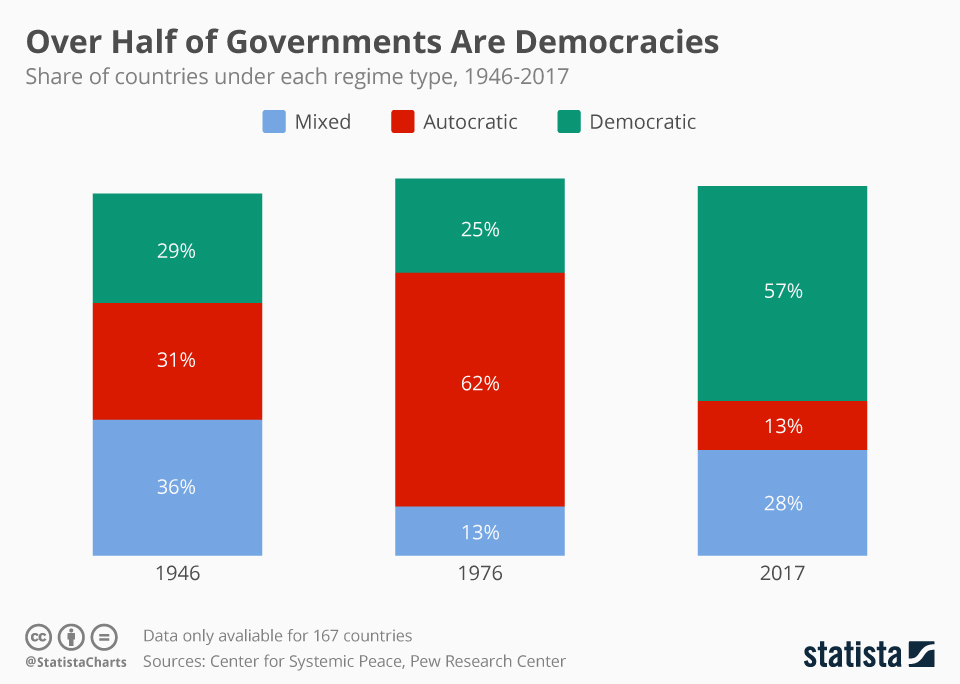
The most recent estimates from the Center for Systemic Peace aggregated by Pew Research show that over half of countries in the world are now democracies, a major shift from forty years ago. Back in 1976, CSP estimates that 62 percent of governments were autocracies while just a quarter of countries had democratic systems.
After World War II, the world's governing systems looked different from where they stood in 1976 and 2017. Around seventy years ago, there was a more even divide between autocratic, democratic, and a mix of those two systems of government. The end of the Cold War acted as another inflection point. After the Cold War, there was an uptick in global democracy as Soviet-bloc states and the Soviet Union broke apart in the late 1980s and early 1990s.
Polity is CSP’s ongoing project that examines six indicators when evaluating whether a country is autocratic or democratic, looking at everything from political participation to checks on executive power. Each country that has over 500,000 citizens gets a score. There were 167 countries in the report.
Related Infographics
FAQ
- The Statista "Chart of the Day", made available under the Creative Commons License CC BY-ND 3.0, may be used and displayed without charge by all commercial and non-commercial websites. Use is, however, only permitted with proper attribution to Statista. When publishing one of these graphics, please include a backlink to the respective infographic URL. More Information
- The Statista "Chart of the Day" currently focuses on two sectors: "Media and Technology", updated daily and featuring the latest statistics from the media, internet, telecommunications and consumer electronics industries; and "Economy and Society", which current data from the United States and around the world relating to economic and political issues as well as sports and entertainment.
- For individual content and infographics in your Corporate Design, please visit our agency website www.statista.design
Any more questions?
Get in touch with us quickly and easily.
We are happy to help!
Do you still have questions?
Feel free to contact us anytime using our contact form or visit our FAQ page.
Your contact to the Infographics Newsroom
Statista Content & Design
Need infographics, animated videos, presentations, data research or social media charts?