An estimated $630 billion worth of traded goods is caught in the crossfire of President Trump’s trade war. While the U.S. has enacted tariffs on $524 billion of goods, the countries and economic zones at the other end of the tax have pushed back with retaliatory taxes.
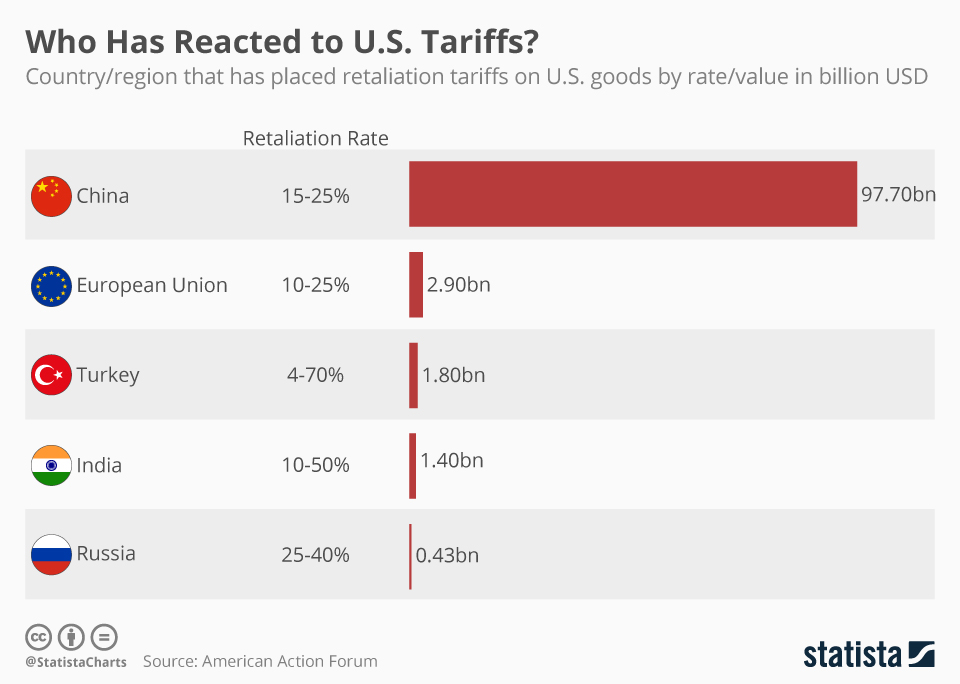
As it stands now, China has pushed back the hardest against U.S. tariffs. With the newest round of trade talks stalled, the total number of tariffs the Chinese have placed on U.S. goods now numbers over $97 billion. In that same vein, U.S. tariffs targeting Chinese goods now total around $240 billion. Likewise, the EU is now pushing back with tariffs targeting U.S. goods totaling around $3 billion.
These taxes increase the cost of doing business. By and large, companies have not passed along that cost to the consumer. Instead, businesses have largely stomached the uncertainty and absorbed costs by cutting into their margins.
American Action Forum estimates that overall consumer costs could increase to roughly $115 billion annually across the U.S. if businesses start passing along those costs to customers. While consumer sentiment has remained largely high for this reason, the economic outlook of business executives has soured in many parts of the world.
Who Has Reacted to U.S. Tariffs?
Trade Tariffs

Description
This chart shows the country/region that has placed retaliation tariffs on U.S. goods, by rate and value in billion USD.


