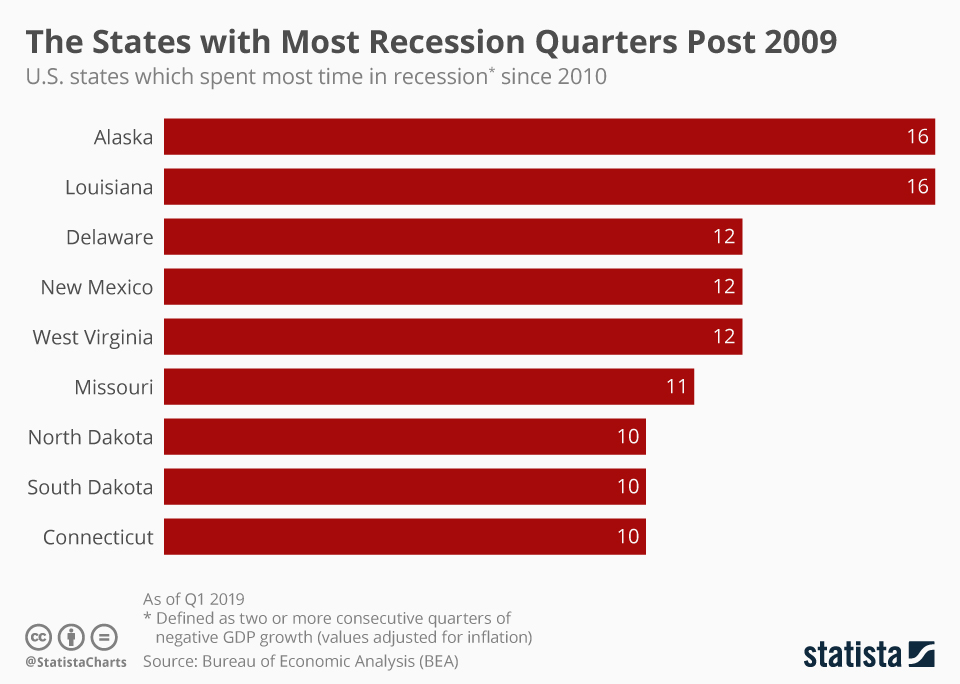
Alaska and Louisiana top the list of states that have spent most time in recession since 2010, an analysis of BEA data reveals. Both states spent 16 quarters in recession (defined as two or more consecutive quarters of negative GDP growth.)
Several economic indicators (among them the U.S. treasury yield curve) are currently signaling that the U.S. economy could experience another recession soon, stoking fears among investors and businesses. According to Quartz, less people have been moving across state lines for work recently, making state-wide recessions a growing cause of concern for many.
Alaska and Louisiana, as well as New Mexico, rank highly because their economies rely on fossil fuels, which are subject to a lot of global price fluctuations. States like Connecticut and Delaware show up on the list because small states tend to be more volatile. Same as oil-reliant states, smaller economies often lack diversity. If a certain sector suffers, the whole state economy does as well.
Related Infographics
FAQ
- The Statista "Chart of the Day", made available under the Creative Commons License CC BY-ND 3.0, may be used and displayed without charge by all commercial and non-commercial websites. Use is, however, only permitted with proper attribution to Statista. When publishing one of these graphics, please include a backlink to the respective infographic URL. More Information
- The Statista "Chart of the Day" currently focuses on two sectors: "Media and Technology", updated daily and featuring the latest statistics from the media, internet, telecommunications and consumer electronics industries; and "Economy and Society", which current data from the United States and around the world relating to economic and political issues as well as sports and entertainment.
- For individual content and infographics in your Corporate Design, please visit our agency website www.statista.design
Any more questions?
Get in touch with us quickly and easily.
We are happy to help!
Do you still have questions?
Feel free to contact us anytime using our contact form or visit our FAQ page.
Your contact to the Infographics Newsroom
Statista Content & Design
Need infographics, animated videos, presentations, data research or social media charts?