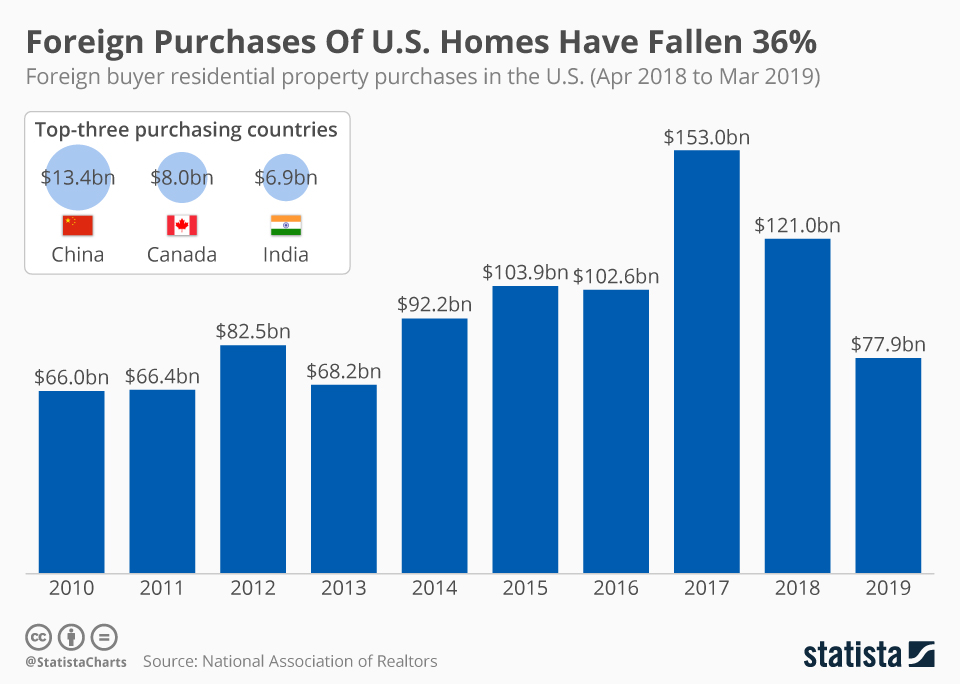
The National Association of Realtors has released a report showing that foreign demand for U.S. residential property is evaporating. Between April 2018 and March 2019, foreigners purchased 183,100 properties with an average price of $426,100, totaling $77.9 billion. That represents a 36 percent drop on the year before when buyers from overseas snapped up 266,800 properties which each averaging $454,600, adding up to $121 billion.
The slump was driven by many factors such as slower economic growth abroad, tighter capital controls in China, a stronger U.S. dollar and a low inventory of homes for sale, all of which have combined to imply less confidence in owning a U.S. property. As in the past, Florida was once again the epicenter of investment and the Sunshine State attracted 20 percent of all foreign buyers from April 2018 to March 2019. California came second with 12 percent while Texas rounded off the top-three with 10 percent.
For the seventh year in succession, Chinese buyers pumped the most money into the U.S. residential property market and the dollar value of their purchases added up to $13.4 billion. As impressive as it sounds, it actually represents a 56 percent decline on the previous 12-month period when purchases totaled $30.4 billion. Canadians had the second highest purchase volume at $8 billion while buyers from India came third with $6.9 billion.
Foreign Purchases Of U.S. Homes Have Fallen 36%
Residential Property Market

Description
This chart shows foreign buyer residential property purchases in the U.S. (Apr 2018 to Mar 2019).


