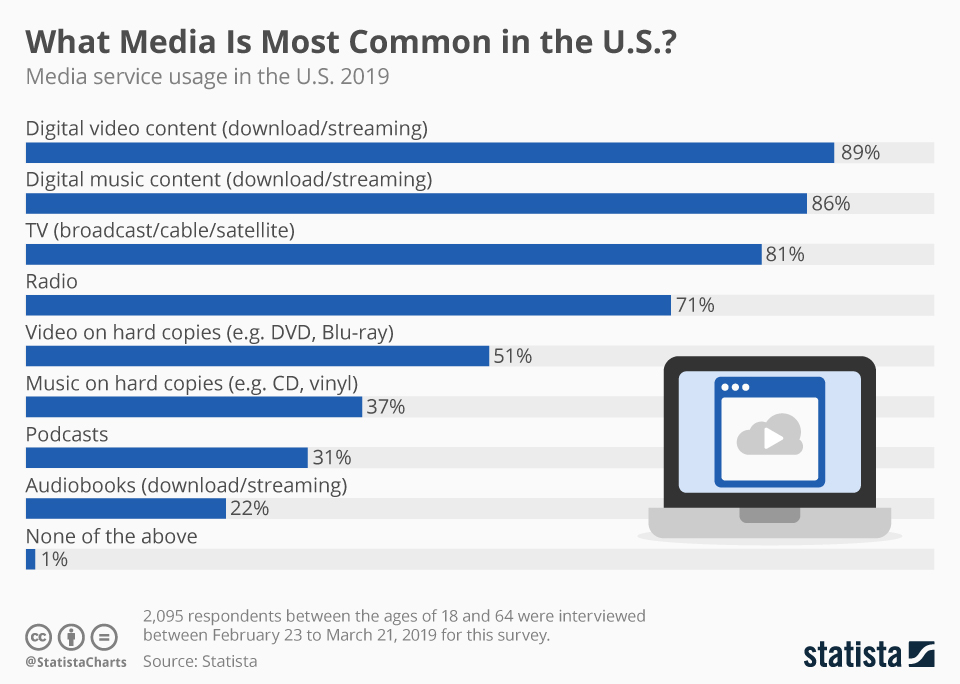
Video is king with a growing crown. Nearly all U.S. respondents in a recent Statista survey reported using video download or streaming within the past year, topping usage of traditional channels like TV and radio.
About eighty percent of respondents reported watching TV in the form of broadcast, cable, or satellite, while around seventy percent of users said they had used radio within the past year. On the other hand, digital video, in the form of streaming and downloading, had surpassed TV by about ten percentage points while video usage surpassed radio by about 20 percentage points.
These findings are backed by reports from Nielsen and MPAA out this year that confirms the continued fall of TV. According to Nielsen, young adults between the ages of 18 to 34 continued to drive video consumption, particularly on their smartphones. MPAA also found that streaming video subscriptions bypassed cable television for the first time last year, with over 613 million streaming subscriptions worldwide. While usage and subscriptions have bypassed cable television, that medium still brings in more money than streaming making $118 billion worldwide in 2018.
What Media Is Most Common in the U.S.?
Media Usage


