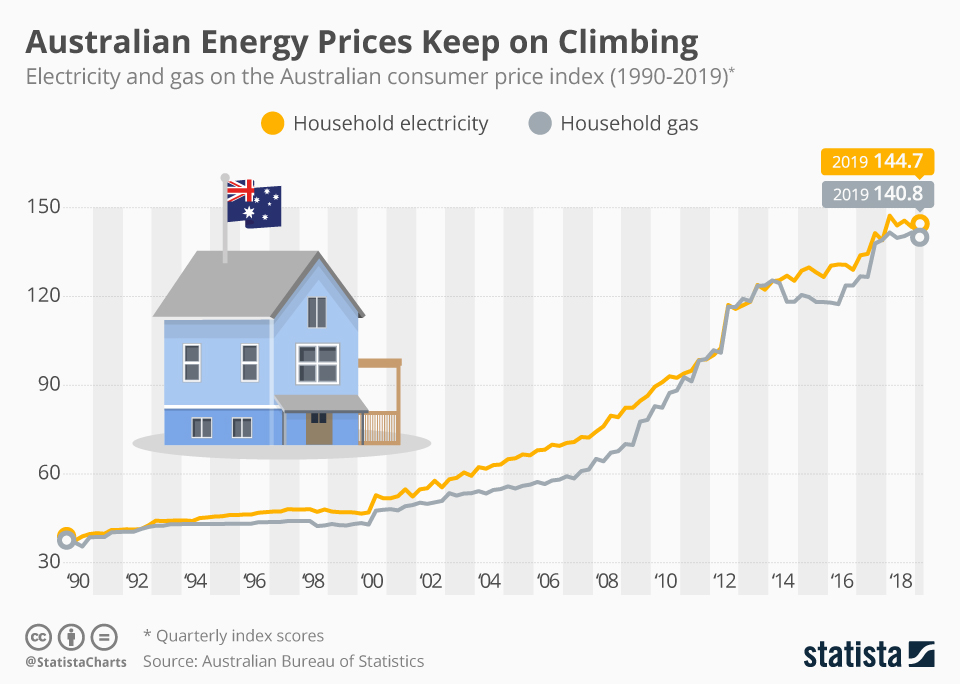
Energy prices in Australia have been skyrocketing in recent years, leaving consumers wary about how to pay for their ever-increasing electricity and gas bills. Prices bottomed out in 2013 and 2014 and again in the last year and a half up until the first quarter of 2019, which is the latest on record, but the general upwards trend is not broken up. In the last decade, electricity prices have doubled or close to doubled for many consumers, according to the Tariff Tracking project.
Electricity wholesale prices spiked again after the surprise election win for the incumbent Coalition government in connection with announcements by the Morrison administration to try and cut wholesale electricity prices down. The government had announced it would envision a cap at AUS$70 per megawatt hour, which in turn caused averages prices to increase to AUS$90/megawatt hour because of the ensuing uncertainty in the sector, according to the Sydney Morning Herald.
The government itself has said that it has limited power in dictating energy prices on the free market. High prices in Australia came about because of a combination of different factors – from infrastructure updates being passed on to the consumer, the longtime lack of a default price (a no-strings attached base price for electricity that companies are then supposed to undercut with different offers) to confusing pricing strategies which led to consumers who didn’t switch around different deals frequently ending up with much higher bills over time. The default price, at least, will be introduced on July 1, following a decision by the Australian Energy regulator.
Australian Energy Prices Keep on Climbing
Energy Cost

Description
This chart shows the price increase of household electricity and household gas on the Australian consumer price index from 1990 until 2019.


