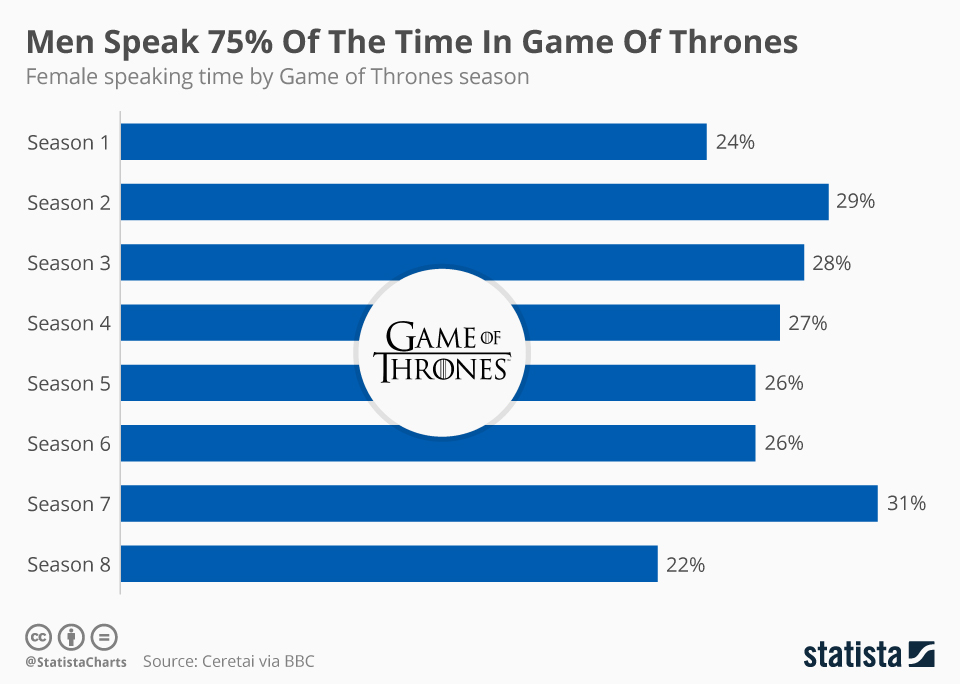
Debate has been raging about the final Game of Thrones season with many fans saying it was rushed and others criticizing its writing. Frustration has been so high that a petition asking for HBO to remake the last season attracted nearly 1.5 million signatures. Another lesser debate has also been taking place regarding the show's representation of women. New data from Swedish start-up Ceretai published by the BBC shows that male speech accounts for 75 percent of all speaking time across all eight seasons.
Ceretai came to that conclusion by using machine learning for their analysis involving an algorithm which can identify the difference between male and female voices in video. The following infographic shows just how low female speaking time was throughout Game of Thrones and it only edged above 30 percent during Season 7. Even in Season 8 where female characters were central to the plot, speaking time was actually lowest at just 22 percent. How does Game of Thrones compare with the film industry for female representation? When USC Annnenberg analyzed inequality in 900 films from 2007 to 2016, they found that female speaking characters had a prevalence of 31.4 percent, higher than the Game of Thrones average.
Men Speak 75% Of The Time In Game Of Thrones
Game of Thrones


