Indians are currently going to the polls and economic woes could well prove the sticking point of the election. Prime minister Narendra Modi’s ambitions for reelection have dimmed together with economic outlook in the world’s biggest democracy.
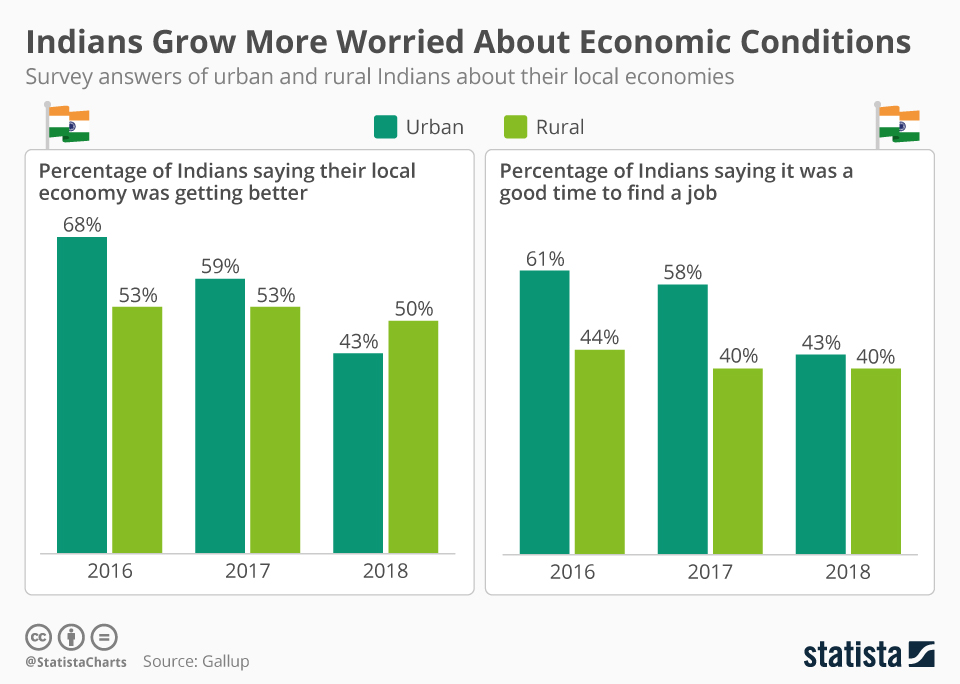
According to surveys by Gallup, less Indians think their local economy is improving than did two years ago. The same is true for job prospects, as less Indians believe it’s a good time to be searching for a job. A decline in satisfaction is visible for all Indians but is more pronounced among urban populations. At the same time, Modi’s approval ratings have been somewhat lower in urban areas.
For the first time, rural Indians had a more positive view of their local economy than city dwellers. This could have to do with the launch of India’s new centralized consumption tax in 2017 which is thought to have affected cities more heavily, according to Gallup.
Indians Grow More Worried About Economic Conditions
Lok Sabha

Description
This chart shows survey responses of rural and urban Indians about the state of the economy between 2016 and 2018.


