New World Health Organization data has revealed that measles cases across the globe have risen 300 percent in the first three months of 2019 compared to the same period last year. All world regions experienced outbreaks but Africa was the worst impacted with its cases soaring 700 percent. Alarming enough as that is, the WHO said that the actual numbers could be much greater as only one in ten cases gets reported worldwide. So far in 2019, 170 countries have reported 112,163 measles cases compared to 163 countries reporting 28,124 cases in the first three months of 2018.
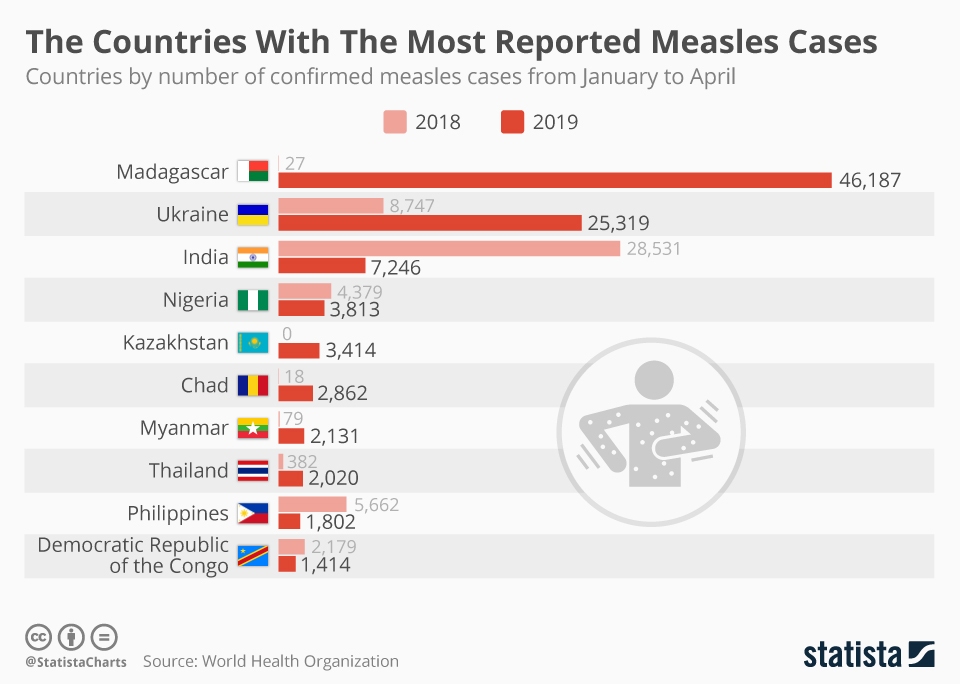
One of the worst countries affected is Madagascar where at least 800 people died from the disease since September. According to WHO data, it is the country with the highest number of measles cases worldwide with 46,187 confirmed between January and April. During the same period last year, the country only had 27 confirmed cases in total. Ukraine has the second highest number cases, 25,319, while India has the third-highest with 7,246. The geographical variation of the countries stuggling to contain the disease starkly illustrates its new global prevelance.
Worryingly, spikes in case numbers have occurred in countries with high levels of vaccination coverage such as the United States, Israel, Thailand and Tunisia. Just last week, New York mayor Bill de Blasio declared a public health emergency in parts of Brooklyn after a measles outbreak in an ultra-Orthodox Jewish community. The latest WHO data is heightening concerns about the spread of anti-vaccination misinformation, particularly over social media.
The Countries With The Most Reported Measles Cases
Measles

Description
This chart shows countries by number of confirmed measles cases from January to April.


