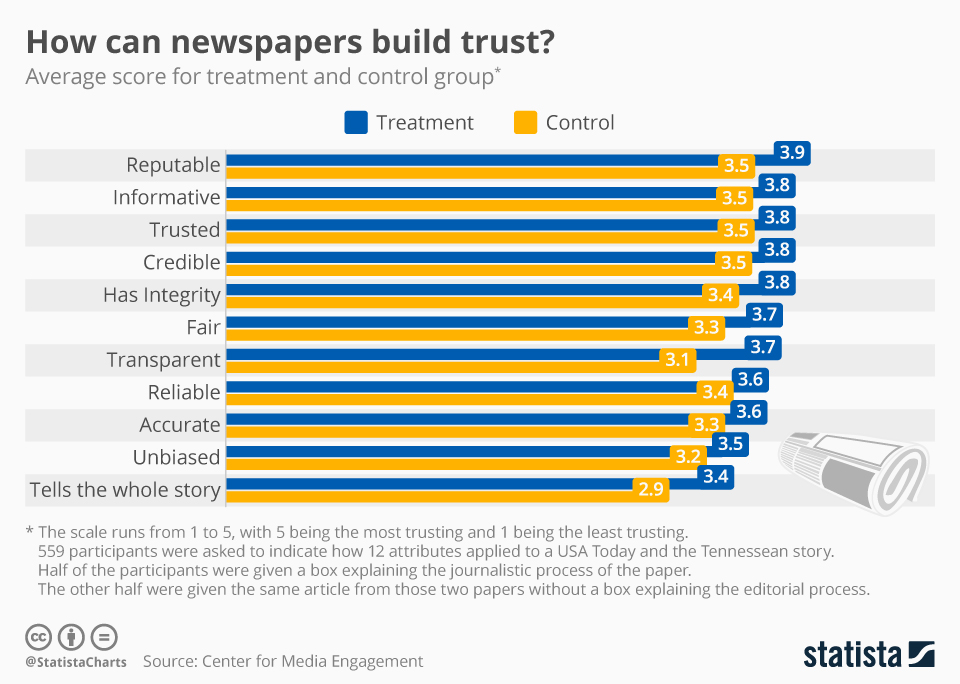
At a time when trust in the news is crawling out of historic lows, a new study from the Center for Media Engagement provides promising interventions to promote readers’ trust in news stories. Researchers found that adding a box to news articles explaining the journalistic process significantly bolstered trust across 11 different attributes.
USA Today and the Tennessean, a regional U.S. newspaper, provided researchers with two stories from each paper to test out the efficacy of the explanation box with readers. Each media outlet randomly distributed a link with the experimental explanation and a link to the same story without the box to their respective audiences. The story USA Today provided discussed Amazon’s headquarters search, while the Tennessean article examined a viral Facebook post that gave the false impression that a veteran had been declined medical care.
The study found that the explanation box boosted trust in each story for 11 of 12 attributes that touch on different facets of trusting a news story. The explanation box especially helped strengthen trust for the “telling the whole story” and “transparency” attributes when compared to participants who did not receive the box. The only attribute that did not have a significant impact from the box intervention was the “does not have an agenda” factor.
How can newspapers build trust?
Trust in News

Description
This chart shows the average scores for the treatment and control groups for a study on trust in the news.


