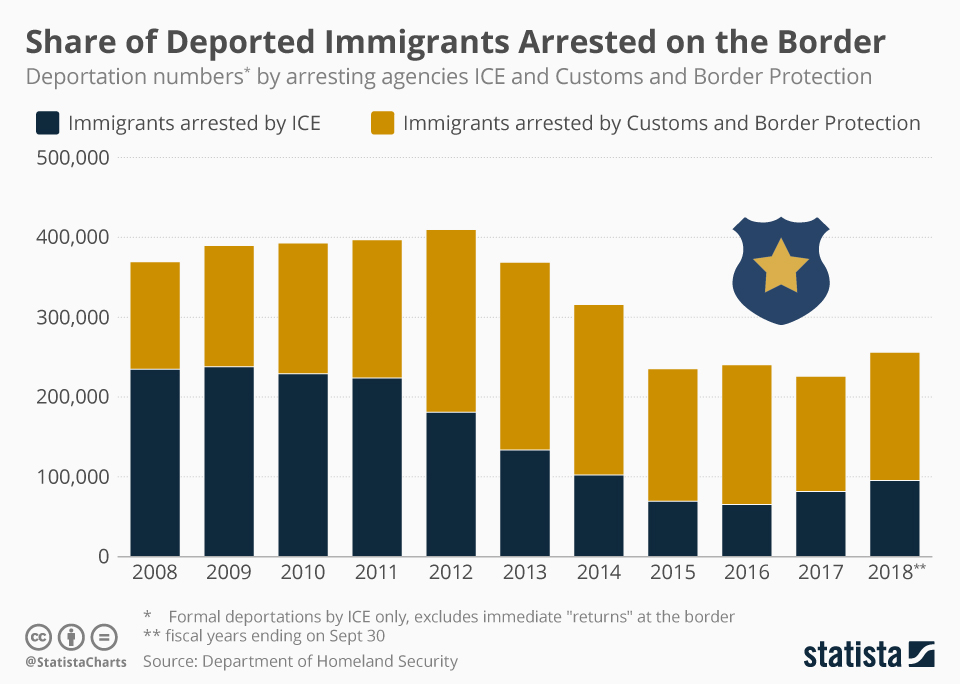
The U.S. Immigration and Customs Enforcement, also known as ICE, has been deporting more undocumented immigrants who were arrested on the border than those who were arrested by ICE in other parts of the country. According to reports by the Department of Homeland Security, approximately 256,000 people were deported by ICE in FY 2018. Almost 170,000 of those had been apprehended by Border and Customs Protection and later handed over to ICE. The trend had been slowing since 2016 when the number of people deported that were not arrested while or right after crossing the border picked up again together with total ICE deportations.
CBP also deported immigrants without handing them over to ICE, but since the agency can’t hold immigrants for as long as ICE does, most of these are so-called expedited removals. These don’t involve a judge and are limited to people who haven’t been in the U.S. for longer than 14 days. In 2016, the latest year on record, roughly 110,000 more immigrants were deported by CBP. In 2016, 85 percent of deportations from the United States were expedited, meaning ICE also uses this method.
So-called returns on the border, where people are simply driven back across the border without a formal order, have been at an all-time low. In 2016, roughly 106,000 people were affected. Their number exceeded 1 million as recently as 2006.
More Deported Immigrants Are Arrested by Border Patrol
Illegal Immigration

Description
This chart shows the number of immigrants deported in the U.S. by ICE, by arresting agency.


