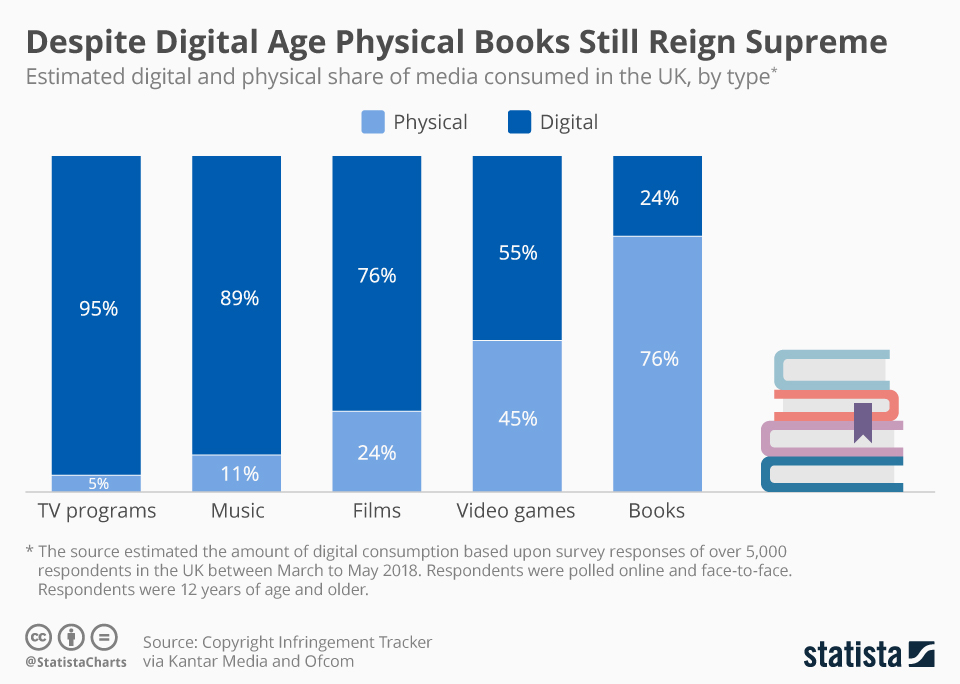
Three-quarters of people in the UK still read physical books rather than their digital equivalents, according to estimates from the Copyright Infringement Tracker.
Despite the widespread prevalence and preference for digital forms of media, physical books were able to maintain their decisive majority in 2018. TV and music are the two types of media most often consumed digitally by UK residents, with about 95 percent of people watching TV digitally, while roughly nine out of ten respondents listened to music digitally. People played video games digitally a little under half the time, which was the only media that came close to the dominance of physical books.
The Copyright Infringement Tracker extrapolated poll results to estimate the volume of digital and physical media consumed by people in the UK. Overall, they estimated that each medium registered a slight decline in overall consumption. Television was the only exception, where consumption is projected to have risen from 145 million in 2017 to 160 million in 2018, mostly driven by digital formats.
Despite Digital Age Physical Books Still Reign Supreme
Media Consumption

Description
This chart shows the estimated digital and physical share of media consumed in the UK, by type.


