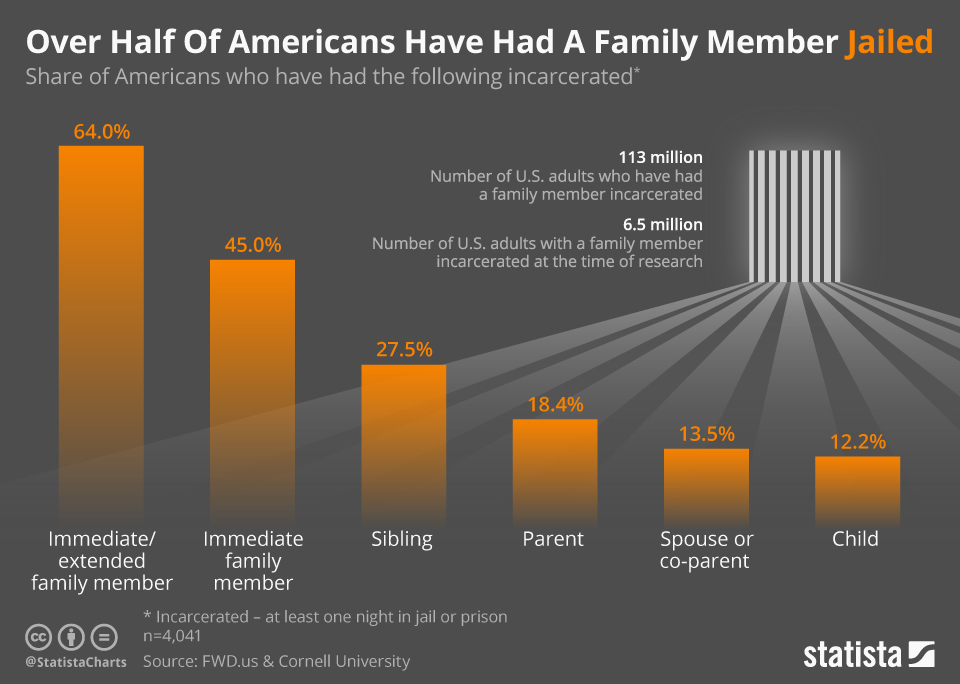
Even though the United States has made a limited amount of progress in reducing its prison population in recent years, it remains four times larger than in 1980. Today, the U.S. has an incarceration rate of 710 inmates per 100,000 of the population, far ahead of the United Kingdom (147), Canada (118) and France (98). New research conducted by criminal justice non-profit FWD.us and Cornell University has found that 64 percent of American adults have had an immediate or extended family member spend time in prison. The researchers described the current situation in the U.S. as an "incarceration crisis".
The following infographic uses the report's findings to try and put that crisis into some sort of perspective. Excluding extended family, almost half of all people in the U.S. have seen someone in their immediate family jailed at some point. 27.5 percent have had a sibling locked up while 18.4 percent have had a parent put behind bars. Additionally, 18.4 percent have had a spuse or co-parent imprisoned, along with 12.2 percent who have had a child jailed.
The brutal reality of the crisis becomes readily apparent by the fact that 113 million U.S. adults have had an immediate family member incarcerated while 6.5 million said a member of their family was in prison at the time of research. Taking a closer look at the figures, black adults are 50 percent more likely than white adults to have immediate family members imprisoned and 3 times more likely to see a loved one imprisoned for a year or more. Latino adults are also 70 percent more likely than white adults to do be locked up for more than a year.
Over Half Of Americans Have Had A Family Member Jailed
U.S. Prison System


