This year's midterms were full of first with voters electing two Native American women and two Muslim for the first time. They also elected the first openly gay governor in U.S. history. While the GOP retained its Senate majority, the Democrats took back control of the House, driven by a group of diverse, progressive and female candidates. By early Wednesday morning, more than 100 female candidates from both parties were projected to win seats in the House of Representatives, a record number.
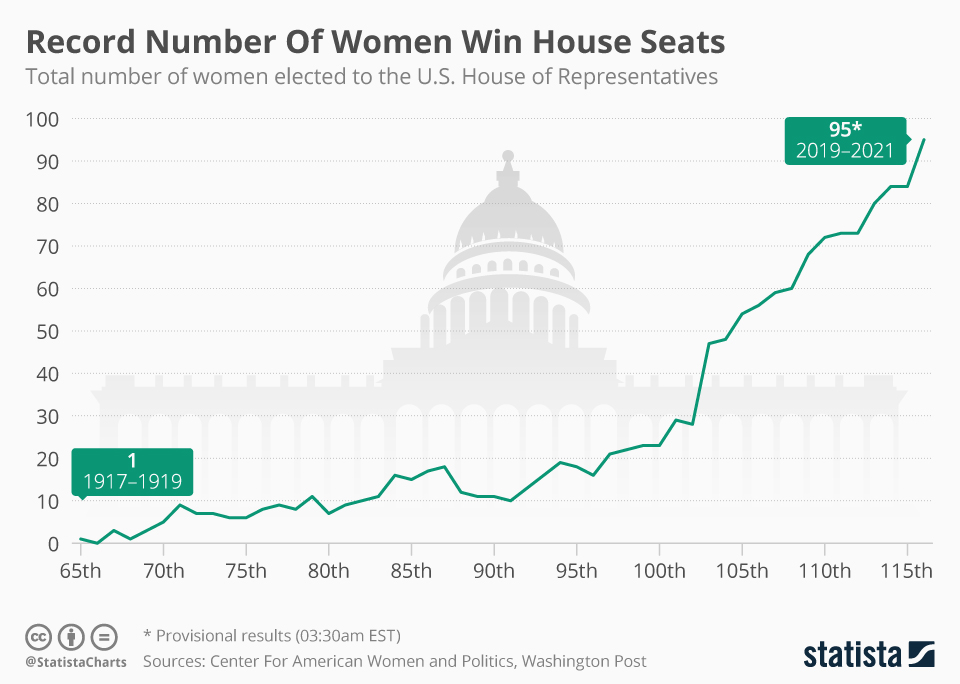
Currently, 84 women are in the House and by 06:00 EST, 95 female candidates were confirmed as being elected. This year saw a wave of women running for office, many of whom were first-time candidates. More than twice as many women ran for Congress this year than in 2016 with most of them Democrats. As the following infographic shows, the American political landscape is experiencing a female transformation. The number of women running for Congress really increased significantly in 1992, the so called Year of the Woman. 24 women won House seats that year, the largest number to ever enter the House in a single election up to that point.
Record Number Of Women Win House Seats
U.S. Midterms

Description
This chart shows the total number of women elected to the House of Representatives.


