Late last week, Hurricane Michael left a trail of destruction along Florida's Panhandle coast, killing at least 19 people, creating widespread electricity outages and ripping homes from their foundations. By the time it made landfall, the storm became a Category 4 hurricane, one of the strongest ever to hit the U.S. mainland with wind speeds of 155mph. As well as the human cost, the hurricane also inflicted considerable financial damage. Accuweather predicted it could result in up to $30 billion in losses. Last week, a report by the United Nations Office for Disaster Risk Reduction claimed that economic losses have skyrocketed over the past twenty years.
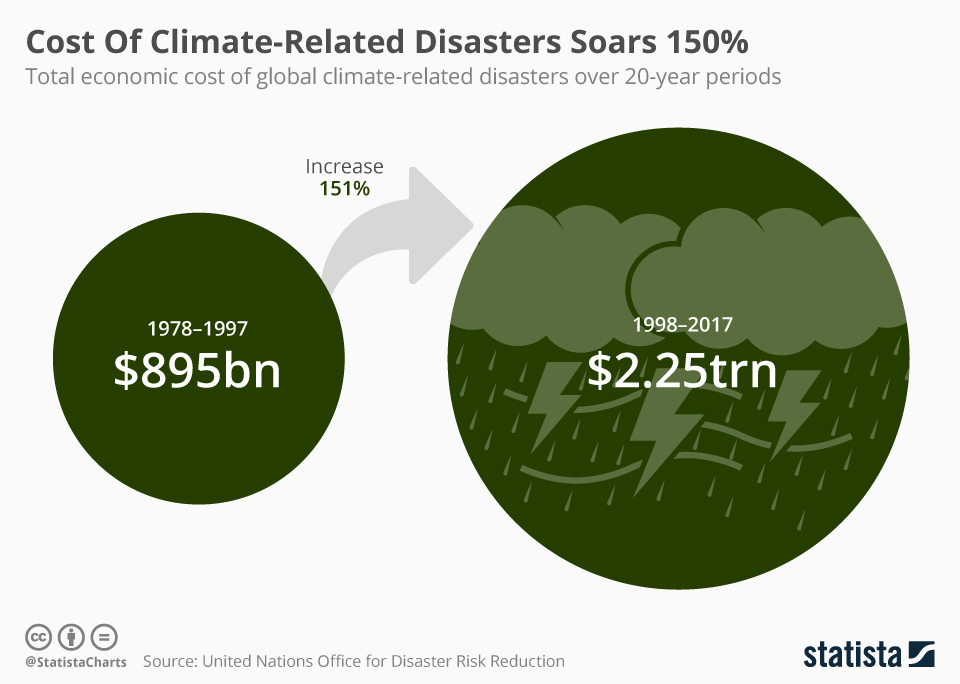
Climate-related disasters such as storms, droughts, floods and heatwaves resulted in an estimated $895 billion in economic losses between 1978 and 1997. In the twenty-year period from 1998 to 2017, the increased 151 percent to $2.25 trillion. During that timeframe, the U.S. had the highest economic losses of any country with $944.8 billion, followed by China with $492.2 billion.
At the beginning of last week, the UN Intergovernmental Panel on Climate Change released a devastating report on the impact of global warming. It found that the world has only 12 years to keep the temperature increase at a maximum of 1.5C. Without urgent action and unprecedented changes, there will be a significantly higher risk of climate-related catastrophies after that window of opportunity closes.
Cost Of Climate-Related Disasters Soars 150%
Natural Disasters

Description
This chart shows the total economic cost of global climate-related disasters over 20-year periods.


