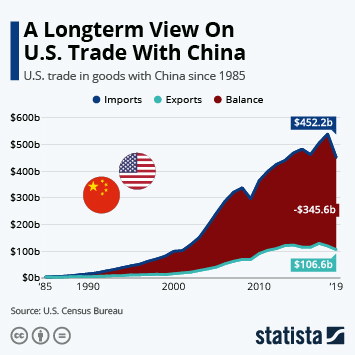
The trade war between China and the U.S. has been dragging on for over a year now. In the beginning of August, U.S. President Donald Trump announced he would put a levy on all Chinese imports in the future. The date now being given for this last round of tariffs is Dec 15, even though some of the new tariffs will kick in by Sept 1, as originally announced.
The first wave of duties mostly affected aerospace, IT and medical equipment. The second wave included many metals and chemicals as well as some everyday consumer goods and food products like meat and fish, while the third round of tariffs rounded up all remaining types of merchandise.
Meanwhile investors and economists are worried this escalating trade war will profoundly impact the global economy while politicians are watching Sino-U.S. relations undergo a profound readjustment.
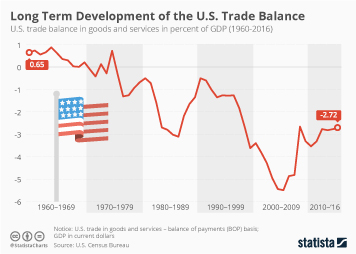
Tensions between the U.S. and China are definitely running high. But how has Donald Trump's confrontational attitude affected trade with China? For many years, China has sold more to the U.S than vice versa, resulting in a U.S. trade deficit with China. In fact, that trade deficit has been growing larger despite the sanctions (and retaliatory measures that were taken). The H1 2019 balance is already at US$-222 billion in favor of China opposed to US$-375 billion for the full year of 2018, with the holiday quarter still ahead.
Related Infographics
FAQ
- The Statista "Chart of the Day", made available under the Creative Commons License CC BY-ND 3.0, may be used and displayed without charge by all commercial and non-commercial websites. Use is, however, only permitted with proper attribution to Statista. When publishing one of these graphics, please include a backlink to the respective infographic URL. More Information
- The Statista "Chart of the Day" currently focuses on two sectors: "Media and Technology", updated daily and featuring the latest statistics from the media, internet, telecommunications and consumer electronics industries; and "Economy and Society", which current data from the United States and around the world relating to economic and political issues as well as sports and entertainment.
- For individual content and infographics in your Corporate Design, please visit our agency website www.statista.design
Any more questions?
Get in touch with us quickly and easily.
We are happy to help!
Do you still have questions?
Feel free to contact us anytime using our contact form or visit our FAQ page.
Your contact to the Infographics Newsroom
Statista Content & Design
Need infographics, animated videos, presentations, data research or social media charts?