When Apple introduced the first iPad back in 2010, the initial reaction was a little subdued. Sure, people were intrigued by its design and by the sheer fact that it was a new Apple product. But at the same time, many people seemed to ask themselves what they might need a tablet for. Was it just an oversized iPod? Was it meant to replace their PC? Were they supposed to work on that thing? In the end, it turned out that it's a little bit of all of it.
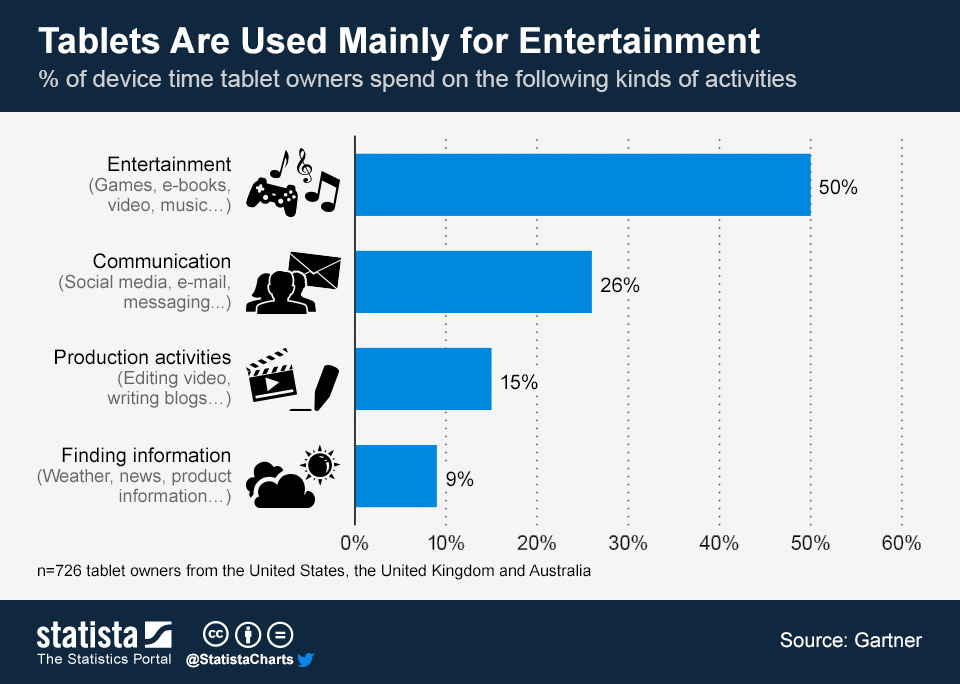
Hundreds of millions of tablets have been shipped since 2010 and one of the reasons for their overwhelming success is arguably their versatility. However, as more and more people actually use tablets, it emerges that tablets are primarily used for entertainment purposes. According to research conducted by Gartner, tablet users spend 50 percent of their screen time on entertainment activities such as gaming, reading or listening to music and only 15 percent of their tablet time on productive activities such as writing or editing video. Moreover, the study suggests that tablets are predominantly used in the evening, i.e. at home, where they serve as a living room companion during leisure time.
There has been a lot of talk about tablets replacing PCs, and the recent decline of PC sales is most likely at least partly triggered by the rise of tablets. However, Gartner's research suggests that there is hope left for the aching PC industry. As long as tablets are seen primarily as leisure devices, PCs won't be obliterated anytime soon.
Tablets Are Used Mainly for Entertainment

Description
Tablet users spend 50 percent of their screen time on entertainment. Activities such as gaming, reading and listening to music trump more productive tasks by a significant margin. A sliver of hope for the PC industry?


