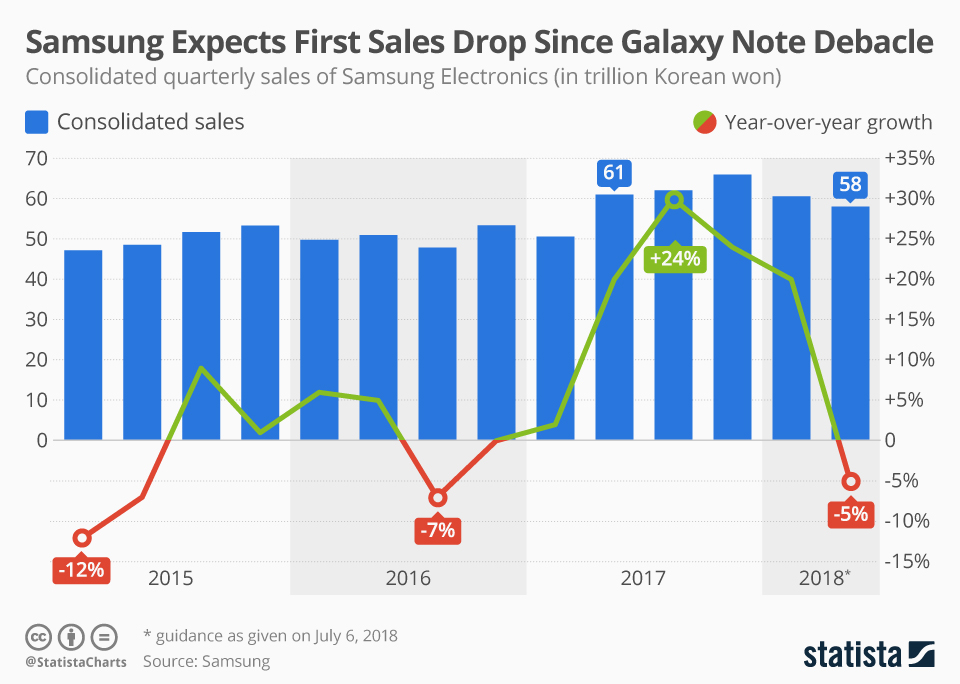
Following four consecutive quarters of record profits, Samsung provided a disappointing earnings guidance for the second quarter of 2018 on Friday. The Korean electronics giant expects sales of 58 trillion won ($51.8 billion) and an operating profit of 14.8 trillion won ($13.2 billion) for the three months ending June 30. This would mark the first profit decline on a quarter-over-quarter basis since Q3 2016 and the first year-over-year sales decline since the same period.
Back in 2016, Samsung’s results had been hit hard by the debacle surrounding overheating batteries of the Galaxy Note 7 smartphone that had to be called back and ultimately taken off the market. This time around, analysts quoted by the Financial Times blame the disappointing results on lackluster demand for the Galaxy S9 flagship phone, which was released this spring. “The S9 phone was expensive with no major differentiation,” said Kim Young-woo, chief technology analyst at SK Securities, offering a possible explanation for the tepid consumer response.
As the following chart illustrates, Samsung’s sales remain at a very high level (and so does its profit), but the latest sales decline is another sign that the smartphone gold rush for companies such as Samsung and Apple might be coming to an end as true innovation is becoming harder to achieve in a maturing market.
Samsung Expects First Sales Drop Since the Galaxy Note Debacle
Samsung


