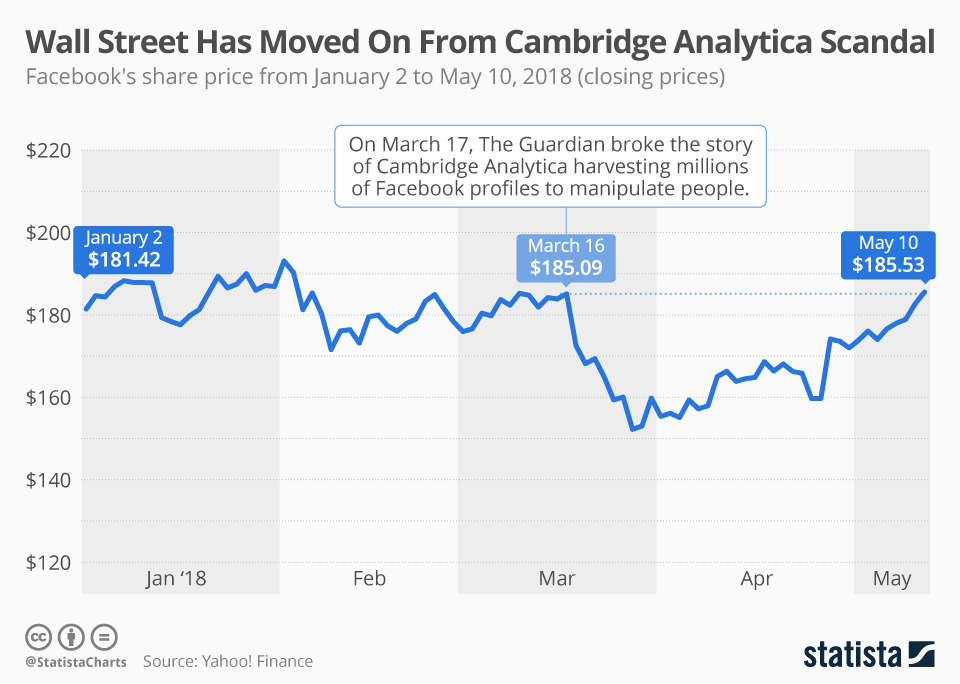
Roughly eight weeks after The Guardian first broke the story of Cambridge Analytica systematically harvesting data from millions of Facebook users in order to manipulate them ahead of the 2016 U.S. presidential election and the U.K.’s Brexit referendum, Facebook has wiped out all of the losses its share price had incurred as the scandal unfolded.
On Thursday, Facebook’s shares closed at $185.53, 0.2 percent above the last closing price before the story broke on March 17. Following the Guardian’s revelations, Facebook had lost $50 billion in market capitalization in two days and, at its lowest point, the company's share price had dropped nearly 20 percent from its pre-scandal level.
Following a series of public apologies and positive first quarter results, it appears as if Wall Street has moved on from the scandal. Perhaps more surprisingly, so have many Facebook users, at least according to a recent survey conducted by Ipsos on behalf of Thomson Reuters.
Wall Street Has Moved On From Cambridge Analytica Scandal

Description
This chart shows how Facebook's share price developed through the first months of 2018.


