Many commentators argue that never since the Vietnam War has the United States been so disunited -so much so, that it feels like people seem to be living in different countries altogether. Some hoped that U.S. President Donald Trump would roll back his divisive campaign rhetoric, take a calmer approach once in office, and try to reunite a torn country. A year in to Trump's presidency, these hopes have evaporated.
Nevertheless, according to custom and constitution, Trump, like other presidents before him, will hold a State of the Union address as required, on Thuesday night at 9 pm EST. Some already fear that his first fully-fledged address will have less to do with stock-taking of where America stands, but will turn out yet another appraisal of how great the president thinks his own performance is - probably unprecedentedly great.
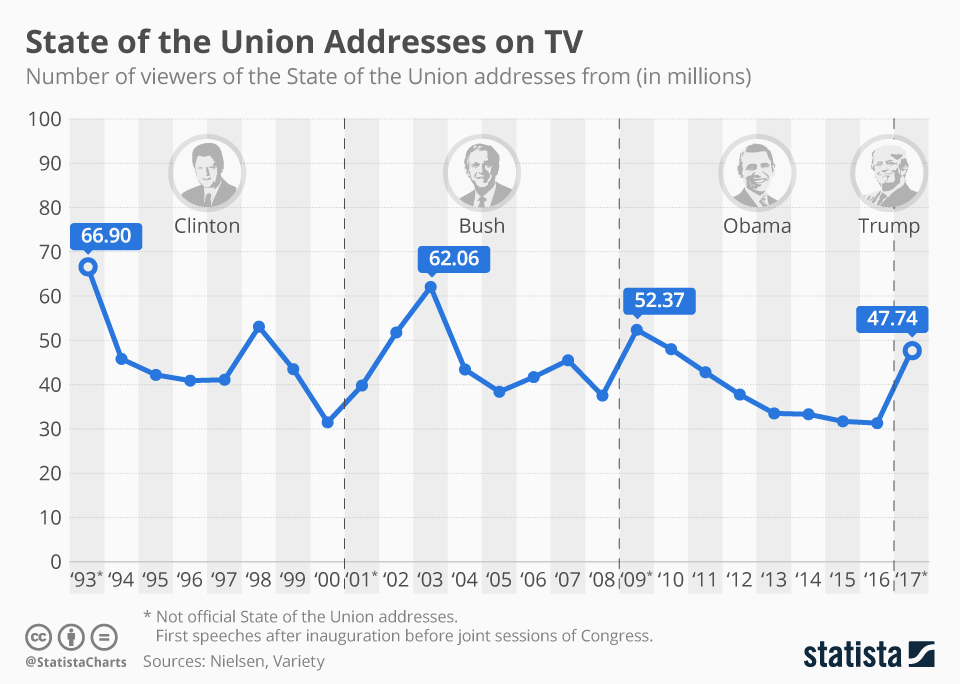
As our infographic based on Nielsen data shows, Trump's first unofficial State of the Union address, held before a joint session of Congress on the last day of February 2017, a few weeks after his inauguration, drew a pretty large TV crowd. However - and these aren’t 'alternative facts' (figures actually include FOX viewers) - Obama, Bush junior and Clinton at some point drew larger TV crowds during similar speeches.
However, to be fair, live TV viewership has been on the decline for some time. So, if the below figures were adjusted for overall live TV viewership, the results would work in favor of more recent debates. One indeed has to accredit Trump with the biggest increase of viewers compared to the last speech by a predecessor. Obama drew 14.9 million viewers more than Bush did at his last speech. Trump increased viewership by 16.4 million compared to Obama's last speech.
Then again, people are just as keen to see a president they like as they can be propelled by ulterior motives, such as seeing a controversial showman perform.
TV Crowds Watching State of the Union Addresses
State of the Union

Description
This chart shows the number of television viewers of State of the Union addresses (in millions)


