2018 is still young and globally, most people are optimistic about the year ahead. According to an online survey conducted by Ipos in 28 countries, 76 percent of people think this year will be better than last year. Levels of positivity fluctuate significantly and countries with younger populations tend to be more optimistic than countries with ageing ones. Taking this into account, Latin America is the world's most optimistic region while due to its ageing population, Europe is the most negative.
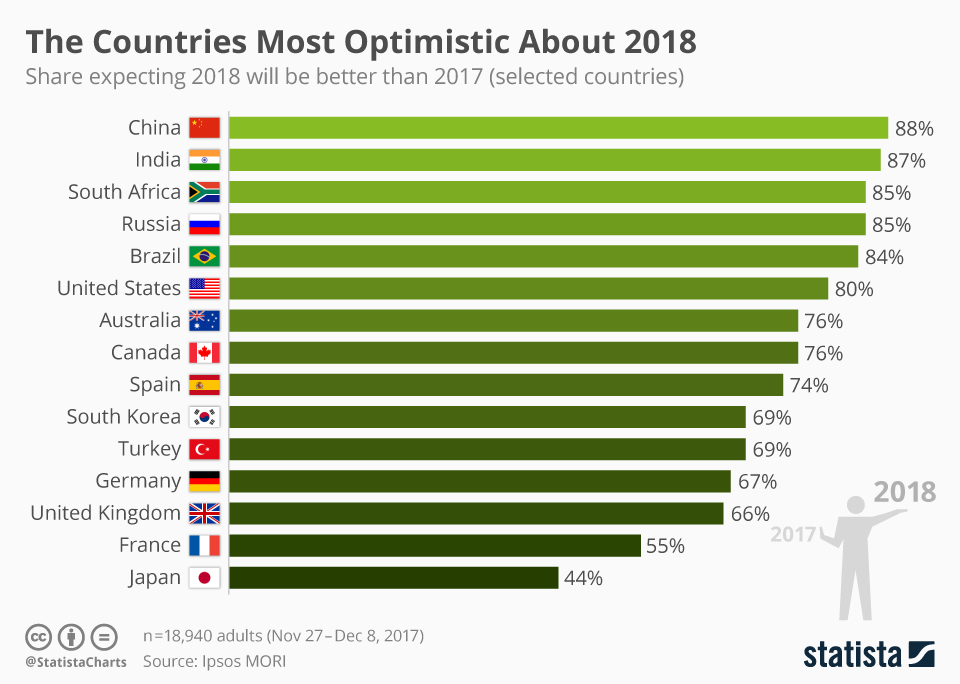
The following infographic shows the situation in several selected countries. Peru and Colombia come first overall in the survey with 93 percent of people saying 2018 will be better than 2017. China was also extremely positive with 88 percent of respondents there expecting improvements this year. That is a similar level of optimism to India where 87 percent are positive about 2018. In the United States, 80 percent of people expect 2018 to be a better year than 2017.
The air of positivity erodes in Europe where 67 percent of Germans, 66 percent of Britons and 55 percent of respondents in France saying they are optimistic about the year ahead. The UK's pessimistic mood is more than likely due to Brexit with a large portion of the population gloomy about the country's forthcoming exit from the EU. Japan came last in the survey with only 44 percent of people optimistic for 2018, primarily due to the country's ageing population.
The Countries Most Optimistic About 2018
Optimism

Description
This char shows the share expecting 2018 will be better than 2017 (selected countries).


