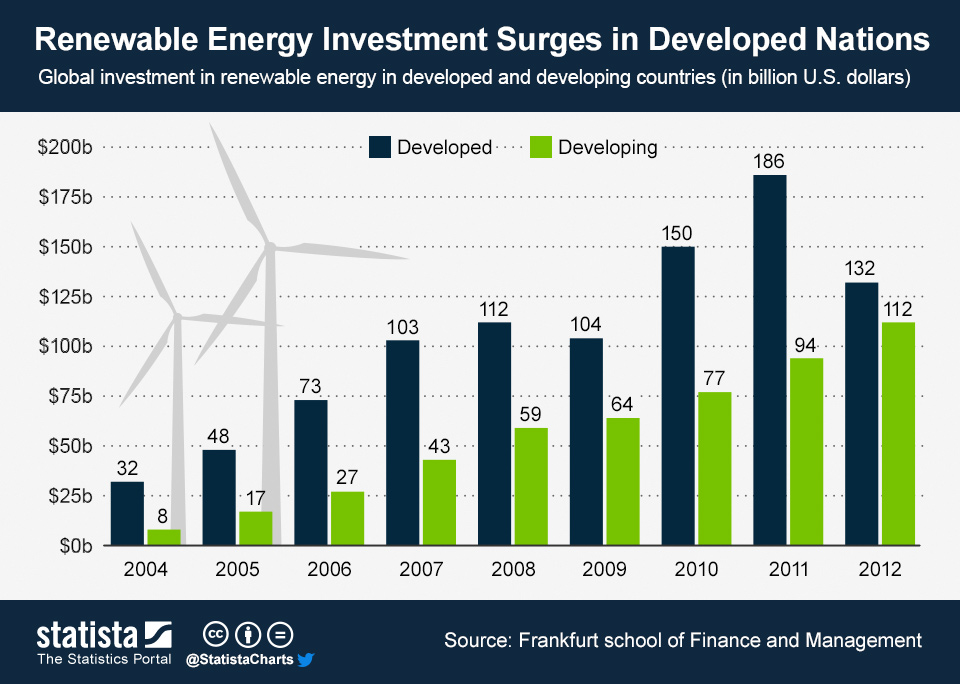
In 2004, developed nations invested $32 billion in renewable energy while developing nations invested $8 billion. Since then, the pace of investment has accelerated rapidly. By 2011, the rush to adopt green energy technology pushed investment to $280 billion around the world.
Unsurprisingly, developed nations invested a substantially higher amount than developing nations. Broken down, this amounts to $186 and $94 billion respectively in 2011. However, the gap certainly has showed signs of narrowing over the years and developing economies overtook their developed counterparts in the public markets category of investment for the first time in 2010.
Interestingly, the situation changed significantly in 2012. Developed countries experienced a major renewable energy slump and investment dropped 29 percent to $132 billion. At the same time, investment in developing countries rose by 19 percent to $112 billion. There is just an 18 percent gap between the two, confirming the fact that developing countries are on course to overtake developed countries in renewable energy investment in the near future.
What went wrong for developed nations in 2012? The 12 percent decline can be attributed to investor concern over policies supporting renewable energy in Europe and the United States, both traditional markets. Developers, equity providers and lenders all demonstrated an air of uncertainty with regards to the scheduled expiry dates of renewable energy subsidies.
Renewable Energy Investment Surges in Developed Nations

Description
This chart shows global investment in renewable energy in developed and developing countries.


