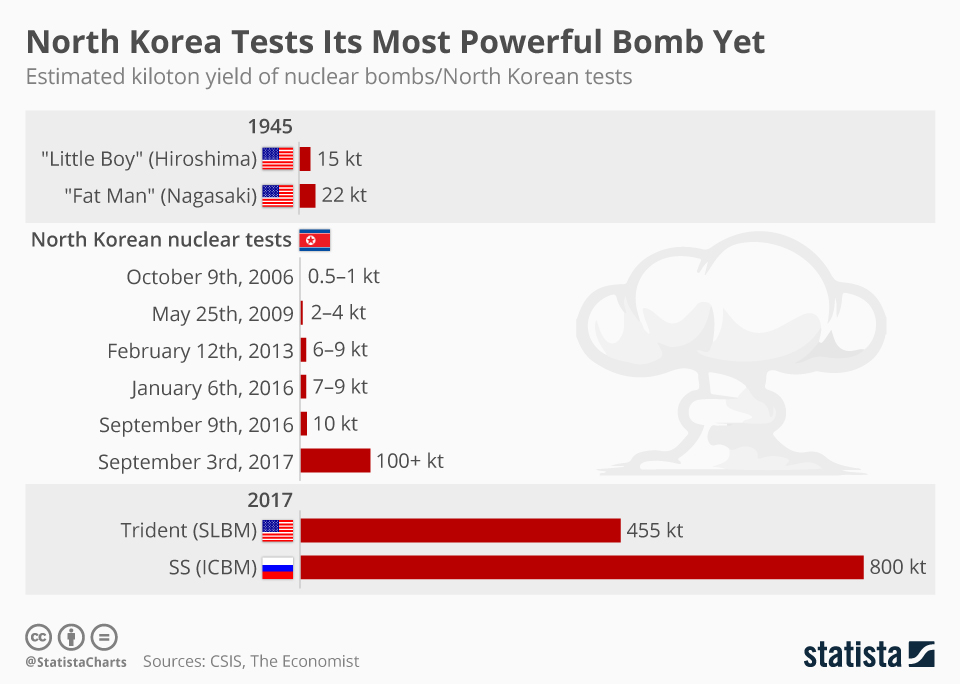
On Sunday, North Korea tested its most powerful nuclear bomb yet, detonating a device that caused a 6.3 magnitude tremor. The weapon's sheer power has caused alarm but the fact that Pyongyang is claiming it can be fitted inside an intercontinental ballistic missile is sending shockwaves through Asia and beyond.
Using data from the Center for Strategic and International Studies, the following infographic provides an overview of the strength of all North Korean nuclear tests since 2006. Sunday's detonation was estimated to have been 100 kilotons or more, far more powerful than previous tests and the atomic bombs dropped on Hiroshima and Nagasaki. How does it compare with the warheads inside current U.S. and Russian intercontinental ballistic missiles? According to the Economist, the U.S. Trident and Russian SS ballistic missiles have a yield of 455 and 800 kilotons respectively.
Related Infographics
FAQ
- The Statista "Chart of the Day", made available under the Creative Commons License CC BY-ND 3.0, may be used and displayed without charge by all commercial and non-commercial websites. Use is, however, only permitted with proper attribution to Statista. When publishing one of these graphics, please include a backlink to the respective infographic URL. More Information
- The Statista "Chart of the Day" currently focuses on two sectors: "Media and Technology", updated daily and featuring the latest statistics from the media, internet, telecommunications and consumer electronics industries; and "Economy and Society", which current data from the United States and around the world relating to economic and political issues as well as sports and entertainment.
- For individual content and infographics in your Corporate Design, please visit our agency website www.statista.design
Any more questions?
Get in touch with us quickly and easily.
We are happy to help!
Do you still have questions?
Feel free to contact us anytime using our contact form or visit our FAQ page.
Your contact to the Infographics Newsroom
Statista Content & Design
Need infographics, animated videos, presentations, data research or social media charts?