A little more than seven years ago, Twitter founder and CEO Jack Dorsey sent the first tweet. Since then, the microblogging service quickly went from niche platform to one of the largest social networks in the world. And more impressively, Twitter has become the quickest, maybe even the most important channel for news distribution. Major news outlets can no longer afford to ignore the power of Twitter and willingly utilize the service to spread breaking news and other stories.
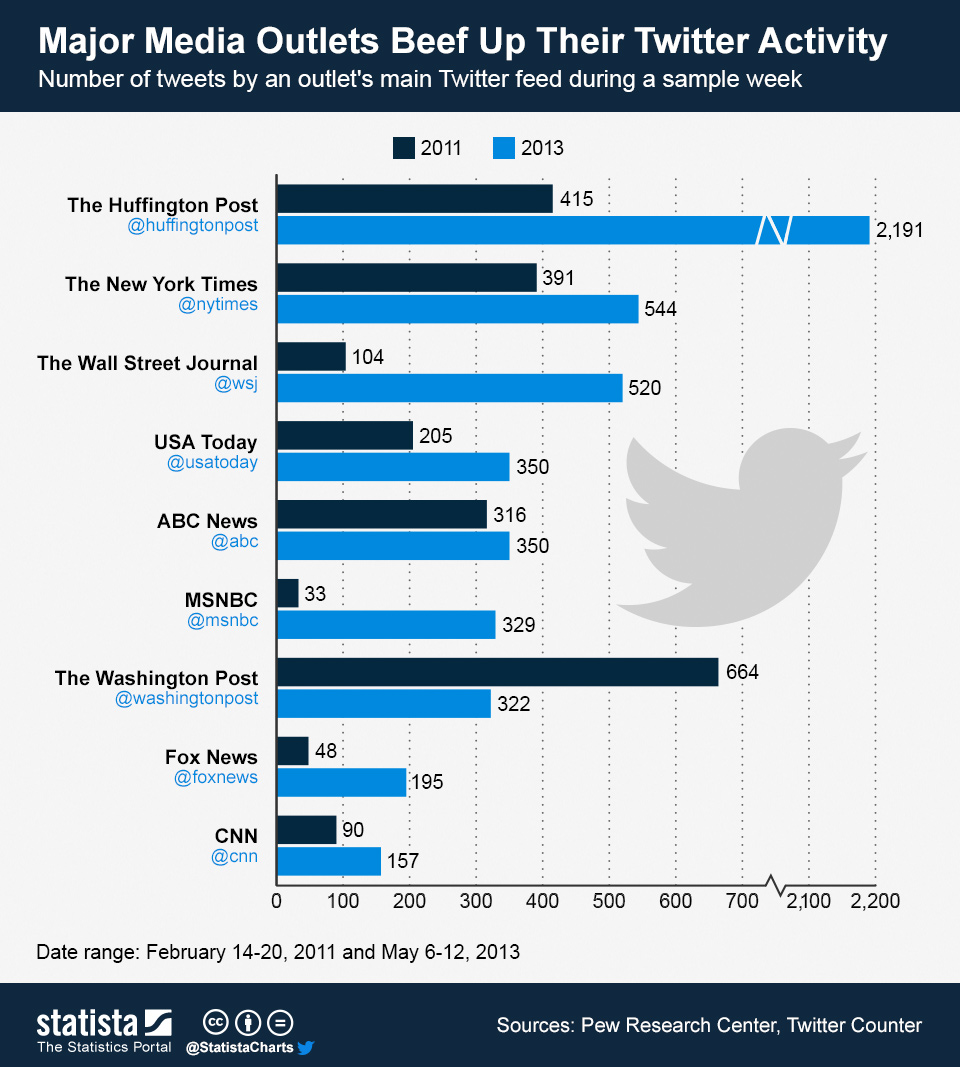
In February 2011, the Pew Research Center monitored the Twitter activity of major American news outlets and we did the same last week to determine how Twitter usage has changed over the past two years. The result comes as no surprise: aside from one exception, all media outlets in the sample have increased their Twitter activity significantly. Most organisations now send more then 300 tweets a week, and that is only counting the main Twitter feed.
Please note that this chart should be treated as no more than anecdotal evidence for increased Twitter activity, as the number of tweets obviously depends on the news situation during the sample week. Nonetheless, the trend is pretty obvious and Twitter's role in today's news environment should not be underestimated.
Major Media Outlets Beef Up Their Twitter Activity


