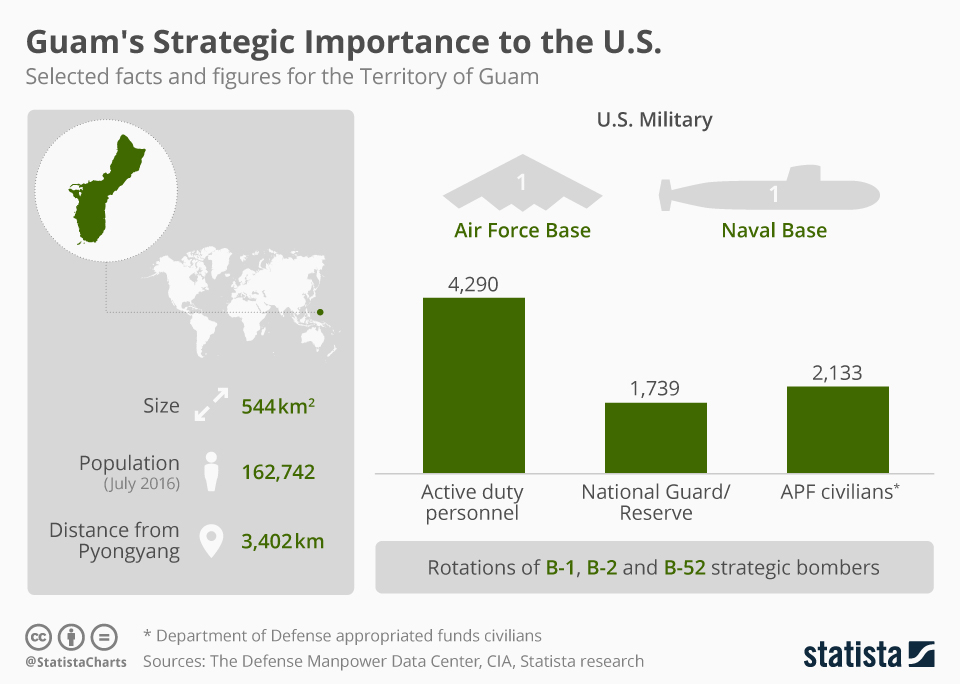
In apparent response to Trump's promise of "fire and fury" in the event of any threat to the United States from North Korea, Pyongyang has said it is "carefully examining" a plan to attack the U.S. Territory of Guam, saying they will engulf the island with an "enveloping fire".
As well as being home to over 162 thousand people, Guam is of key strategic importance to the U.S. military. With a large proportion of the 544km² occupied by the Andersen Air Force Base in the north, home to rotating deployments of B-1, B-2 and B-52 strategic bombers, and a naval base in the west, it is understandable why the island is sometimes referred to as America's 'permanent aircraft carrier'. In terms of personnel, as of March 31, Guam was home to 4,290 active duty Army, Navy and Air Force personnel, 1,739 National Guard/Reserves, as well as 2,133 APF civilians.
Related Infographics
FAQ
- The Statista "Chart of the Day", made available under the Creative Commons License CC BY-ND 3.0, may be used and displayed without charge by all commercial and non-commercial websites. Use is, however, only permitted with proper attribution to Statista. When publishing one of these graphics, please include a backlink to the respective infographic URL. More Information
- The Statista "Chart of the Day" currently focuses on two sectors: "Media and Technology", updated daily and featuring the latest statistics from the media, internet, telecommunications and consumer electronics industries; and "Economy and Society", which current data from the United States and around the world relating to economic and political issues as well as sports and entertainment.
- For individual content and infographics in your Corporate Design, please visit our agency website www.statista.design
Any more questions?
Get in touch with us quickly and easily.
We are happy to help!
Do you still have questions?
Feel free to contact us anytime using our contact form or visit our FAQ page.
Your contact to the Infographics Newsroom
Statista Content & Design
Need infographics, animated videos, presentations, data research or social media charts?