As traditional TV viewing gradually declines, more and more people stream movies and other video content online. That doesn’t mean that they don’t want to watch their favorite show on the big screen though, which is why many combine the best of both worlds and enjoy the flexibility of online video with the comfort of the living room and stream directly to their TVs.
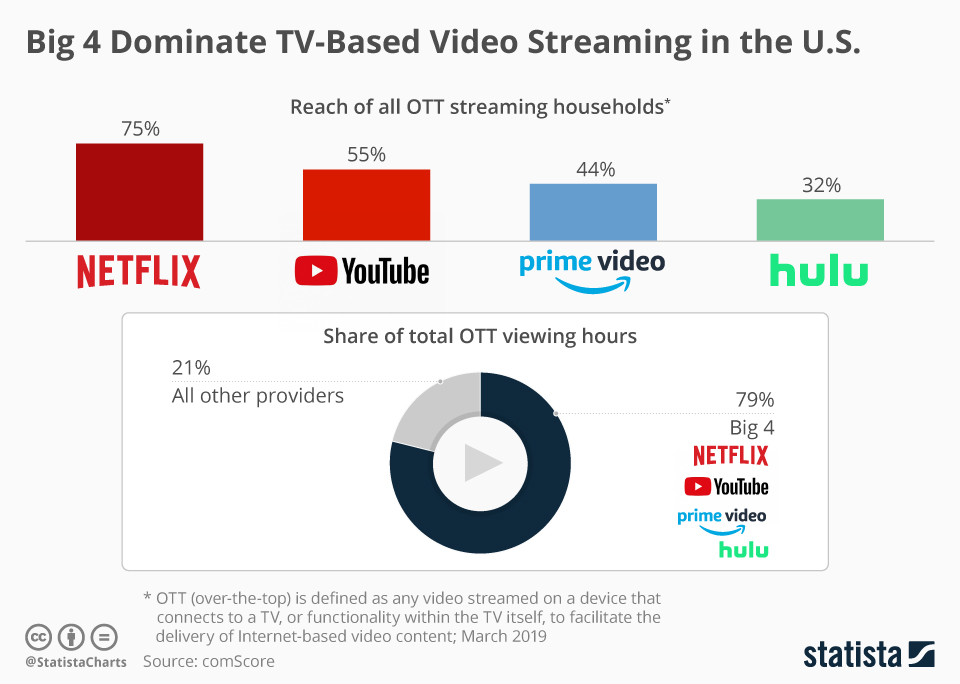
According to a recent comScore report, 64 million households in the U.S. used over-the-top (OTT) streaming in March 2019, meaning they streamed online video to a TV using a set-top box, a streaming stick, a game console or simply a smart TV. As our chart illustrates, Netflix is the most popular service of choice, reaching 75 percent of all OTT households, ahead of YouTube (55 percent), Amazon Prime Video (44 percent) and Hulu (32 percent). According to comScore's estimates, these four streaming services account for 79 percent of all OTT streaming in the United States, which amounted to an average of 86 hours per household in March 2019.
Big 4 Dominate TV-Based Video Streaming in the U.S.
Video Streaming

Description
This chart shows which video streaming services are the most popular for OTT viewing in the United States.


