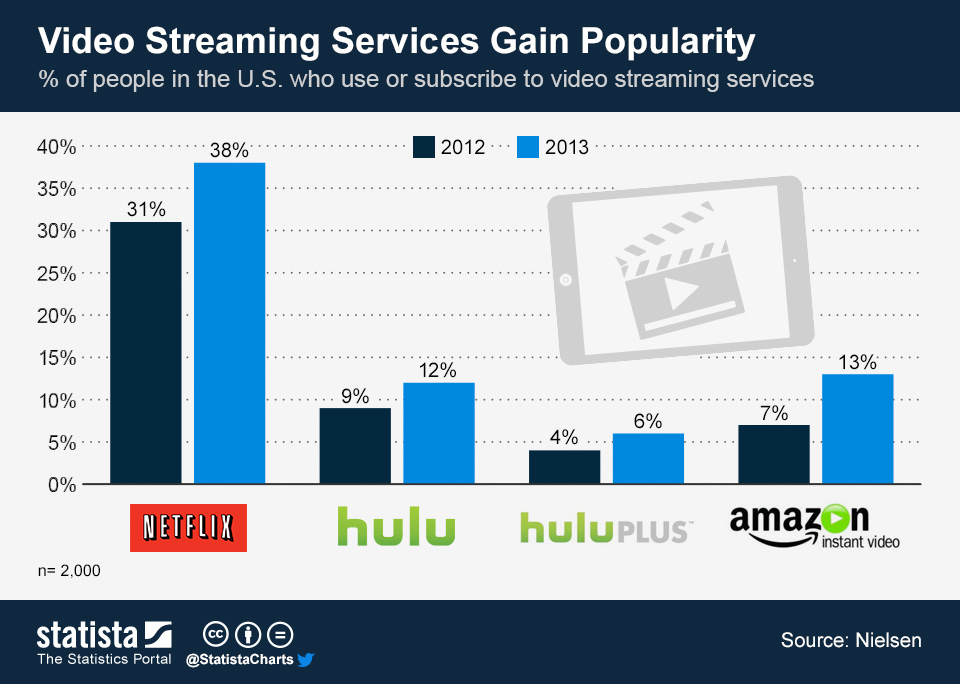
Boosted by original content and evolving viewing habits, video streaming services are quickly entering the American mainstream. According to survey data published by Nielsen, market leader Netflix is used by 38 percent of Americans, up from 31 percent in 2012. Hulu, the joint venture between NBCUniversal, Fox and Disney now reaches 18 percent of Americans, while Amazon's Instant Video service has almost doubled its reach to 13 percent.
Netflix has recently pushed the envelope for streaming services by investing millions of dollars in exclusive content such as the highly-acclaimed political series "House of Cards" or the fourth season of cult comedy "Arrested Development". According to Nielsen's data, the investment is paying off: 45 percent of Netflix streaming subscribers say they watched at least one of the company's original programs.
One of the reasons for the growing adoption of Netflix and co. is the tendency of today's viewers to binge view. In the age of DVD box sets and online piracy, especially younger viewers have grown accustomed to watching entire seasons of their favorite shows in a matter of days rather than stretched out over the entire TV season. 88 percent of Netflix subscribers and 70 percent of Hulu Plus users report binge viewing, defined by Nielsen as watching three or more episodes of one show within 24 hours.
Another factor contributing to the rise of over-the-top video services is their cross-platform availability. Netflix and Hulu for example are available on PCs, gaming consoles, smartphones and other devices, granting users a great deal of flexibility regarding timing and location of their video consumption.
Video Streaming Services Gain Popularity

Description
Video streaming services are becoming increasingly popular in the United States. Tired of linear TV programming, many Americans turn to Netflix, Hulu or other services to consume TV shows wherever and whenever they please.


