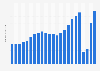
most visited cities in Europe in 2016.
In 2016, there were 7.09 million international overnight visitors to Rome, up from 7.05 million in 2015. Rome also ranked among the 10 Number of international overnight visitors to Rome from 2012 to 2017 (in millions)
Basic Account
Get to know the platform
You only have access to basic statistics.
This statistic is not included in your account.
Starter Account
The ideal entry-level account for individual users
- Instant access to 1m statistics
- Download in XLS, PDF & PNG format
- Detailed references
$199 USD / Month *
Professional Account
Full access
Business Solutions including all features.
* Prices do not include sales tax.
Other statistics that may interest you Statistics on
About the industry
10
- Basic Statistic Leading European cities in international visitor spending 2018
- Basic Statistic International tourism spending in Paris 2019-2022
- Premium Statistic International visitor spending in Singapore 2010-2018
- Premium Statistic International visitor spending in Los Angeles 2010-2018
- Premium Statistic International visitor spending in Miami 2010-2018
- Basic Statistic Cities where international visitors spent the most worldwide 2018
- Premium Statistic International visitor spending in London 2010-2018
- Premium Statistic International visitor spending in New York 2010-2018
- Premium Statistic International overnight visitors to Milan 2012-2018
- Basic Statistic Leading North American cities in international visitor spending in 2016
About the region
10
- Premium Statistic International overnight visitors to Istanbul 2012-2018
- Premium Statistic International visitor spending in Istanbul 2012-2018
- Basic Statistic International overnight visitors in European city destinations in 2016
- Premium Statistic International visitor spending in Rome 2012-2017
- Premium Statistic International visitor spending in Milan 2012-2017
- Premium Statistic Number of tourist arrivals from the U.S. to Europe 2019-2022, by destination
- Premium Statistic Number of tourist arrivals from Mexico to Europe 2019-2022, by region of destination
- Basic Statistic Number of tourist arrivals from Argentina to Europe 2019-2022, by destination
- Premium Statistic Number of tourist arrivals from Brazil to Europe 2019-2022, by destination
- Premium Statistic Number of tourist arrivals from Canada to Europe 2019-2022, by destination
Selected statistics
9
- Premium Statistic Change in number of visitors from Mexico to the U.S. 2018-2024
- Premium Statistic Countries with the highest number of inbound tourist arrivals worldwide 2019-2022
- Premium Statistic International tourist arrivals in Europe 2006-2023
- Premium Statistic Countries with the highest outbound tourism expenditure worldwide 2019-2022
- Basic Statistic Foreign exchange earnings from tourism in India 2000-2022
- Basic Statistic International tourism receipts of India 2011-2022
- Premium Statistic Annual revenue of China Tourism Group Duty Free 2013-2023
- Basic Statistic Number of international tourist arrivals in India 2010-2021
- Premium Statistic Leading countries in the MEA in the Travel & Tourism Competitiveness Index 2018
Other regions
10
- Basic Statistic Leading cities in international visitor spending in the Middle East & Africa in 2016
- Premium Statistic International visitor spending in Chicago 2010-2016
- Premium Statistic International overnight visitors to Paris 2010-2018
- Premium Statistic International overnight visitors to London 2010-2018
- Premium Statistic Leading feeder countries in international overnight visitors to Los Angeles in 2017
- Premium Statistic International overnight visitors to Toronto 2010-2016
- Premium Statistic International overnight visitors to Singapore 2013-2022
- Premium Statistic International overnight visitors to Kuala Lumpur, Malaysia 2010-2018
- Premium Statistic International hotel guests in Barcelona 2018-2021
- Basic Statistic Latin America: international visitors city destinations 2018
Related statistics
10
- Premium Statistic Leading feeder countries in international overnight visitors to London in 2017
- Basic Statistic International overnight visitors in the most popular city destinations worldwide 2018
- Premium Statistic Leading inbound travel markets in Venice 2019-2023, by number of arrivals
- Basic Statistic Number of international tourist arrivals worldwide 2005-2023, by region
- Premium Statistic Number of inbound tourists in Malta 2010-2023, by frequency
- Premium Statistic Number of tourist arrivals in Venice 2003-2023
- Premium Statistic Number of inbound tourists in Malta 2019-2023, by age group
- Basic Statistic Number of tourist arrivals from India to Europe 2019-2022, by destination
- Premium Statistic Number of tourist arrivals from China to Europe 2019-2022, by destination
- Premium Statistic Leading inbound travel markets in Crete, Greece 2019-2022, by number of visits
Further related statistics
10
- Passenger traffic at Dubai Airports from 2010 to 2020*
- Number of visitors to the U.S. from Russia 2011-2022
- Middle Eastern countries with the largest international tourism receipts 2018
- Importance of BRICS countries to UK tourism businesses 2011
- Number of Marriott International hotels worldwide 2009-2023
- Contribution of China's travel and tourism industry to GDP 2014-2023
- Number of international tourist arrivals APAC 2019, by country or region
- Extended stay lodging units: total number in the U.S. 2008-2016
- Music tourist spending at concerts and festivals in the United Kingdom (UK) 2012-2016
- Business class air fares used by corporate clients - growth forecast 2011-2012
Further Content: You might find this interesting as well
Statistics
- Passenger traffic at Dubai Airports from 2010 to 2020*
- Number of visitors to the U.S. from Russia 2011-2022
- Middle Eastern countries with the largest international tourism receipts 2018
- Importance of BRICS countries to UK tourism businesses 2011
- Number of Marriott International hotels worldwide 2009-2023
- Contribution of China's travel and tourism industry to GDP 2014-2023
- Number of international tourist arrivals APAC 2019, by country or region
- Extended stay lodging units: total number in the U.S. 2008-2016
- Music tourist spending at concerts and festivals in the United Kingdom (UK) 2012-2016
- Business class air fares used by corporate clients - growth forecast 2011-2012
MasterCard. (September 26, 2017). Number of international overnight visitors to Rome from 2012 to 2017 (in millions) [Graph]. In Statista. Retrieved May 21, 2024, from https://www.statista.com/statistics/727519/international-overnight-visitors-to-rome/
MasterCard. "Number of international overnight visitors to Rome from 2012 to 2017 (in millions) ." Chart. September 26, 2017. Statista. Accessed May 21, 2024. https://www.statista.com/statistics/727519/international-overnight-visitors-to-rome/
MasterCard. (2017). Number of international overnight visitors to Rome from 2012 to 2017 (in millions) . Statista. Statista Inc.. Accessed: May 21, 2024. https://www.statista.com/statistics/727519/international-overnight-visitors-to-rome/
MasterCard. "Number of International Overnight Visitors to Rome from 2012 to 2017 (in Millions) ." Statista, Statista Inc., 26 Sep 2017, https://www.statista.com/statistics/727519/international-overnight-visitors-to-rome/
MasterCard, Number of international overnight visitors to Rome from 2012 to 2017 (in millions) Statista, https://www.statista.com/statistics/727519/international-overnight-visitors-to-rome/ (last visited May 21, 2024)
Number of international overnight visitors to Rome from 2012 to 2017 (in millions) [Graph], MasterCard, September 26, 2017. [Online]. Available: https://www.statista.com/statistics/727519/international-overnight-visitors-to-rome/