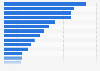
Number of jobs in non-profit institutions serving households in Canada 2000-2022
This statistic shows the number of jobs in non-profit institutions serving households in Canada from 2000 to 2022. In 2022, there were 657,110 jobs in non-profit institutions serving households in Canada.