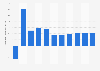
Over the observed period, the exchange rate of British pound sterling to Russian ruble was at its highest at 127.21 at the end of February 2022, while the lowest mark was recorded at the end of March 2017 at 70.48 Russian rubles to one pound. In December 2021, the month-end GBP to RUB exchange rate stood at 101.18.
British pound sterling (GBP) to Russian ruble (RUB) monthly exchange rate from July 2015 to February 2022
Basic Account
Get to know the platform
You only have access to basic statistics.
This statistic is not included in your account.
Starter Account
The ideal entry-level account for individual users
- Instant access to 1m statistics
- Download in XLS, PDF & PNG format
- Detailed references
$199 USD / Month *
Professional Account
Full access
Business Solutions including all features.
* Prices do not include sales tax.
Other statistics that may interest you Statistics on
About the industry
10
- Basic Statistic GBP/CAD FX rate, up until May 21, 2024
- Basic Statistic GBP/EUR FX rate, up until May 21, 2024
- Basic Statistic GBP/USD FX rate, up until May 21, 2024
- Basic Statistic Ruble EUR/RUB FX rate, up until May 21, 2024
- Basic Statistic USD/GBP FX rate, up until May 21, 2024
- Premium Statistic Monthly exchange rate of KRW to EUR 2016-2024
- Premium Statistic Annual exchange rate of KRW to USD 2000-2023
- Premium Statistic Annual exchange rate of KRW to EUR 2000-2023
- Premium Statistic Annual exchange rate of KRW to CNY 2016-2023
- Premium Statistic Monthly exchange rate of KRW to USD 2016-2023
About the region
10
- Premium Statistic Share of Russian ruble in external trade of Russia 2013-2021, by flow
- Premium Statistic Share of external trade calculations in Russia 2021, by currency and flow
- Premium Statistic Bank of Russia foreign exchange and gold assets share 2021-2022, by type
- Basic Statistic Euro to Russian Ruble end-of-month exchange rate 2014-2022
- Basic Statistic U.S. dollar & euro to Russian ruble exchange rate monthly 2008-2023
- Basic Statistic COVID-19 situation in Russia 2023
- Basic Statistic COVID-19 cases, recoveries, and deaths in Moscow 2020-2023
- Basic Statistic Level of trust in Vladimir Putin in Russia 2019-2023
- Premium Statistic Frequency of domestic travel in Russia 2023
- Premium Statistic Urals crude oil price monthly 2007-2024
Other regions
10
- Premium Statistic Annual exchange rate of KRW to 100 JPY 2000-2023
- Premium Statistic Monthly exchange rate of KRW to CNY 2016-2023
- Premium Statistic Monthly exchange rate of KRW to INR 2016-2023
- Premium Statistic Factors that influence the dynamics of the exchange rates in Romania 2020
- Premium Statistic Exchange rate estimates for Hungarian forint to Euro Q3 2014 - Q4 2016*
- Premium Statistic Annual exchange rate of KRW to CAD 2000-2023
- Basic Statistic Average exchange rate of 100 Japanese yen to Singapore dollars 2014-2023
- Premium Statistic Impact of joining the euro on loss of economic control in non-euro EU states 2022
- Premium Statistic Consequences of joining the euro in non-euro EU member states 2022, by country
- Basic Statistic Average exchange rate of Australian dollars to Singapore dollars 2014-2023
Related statistics
8
- Premium Statistic Annual deposit interest rate in Russia 2011-2022
- Premium Statistic Annual deposit interest rate in Ukraine 2011-2022
- Premium Statistic Currency distribution Russian government bonds in 2020
- Basic Statistic Carsharing market revenue in Russia 2017-2020
- Basic Statistic Russian vodka importers in 2020
- Premium Statistic Level of cash use in Ukraine 2008-2019
- Premium Statistic Monthly value of foreign currency purchases by Russian government 2018-2020
- Premium Statistic Leading luxury fashion brands in Russia 2013, by sales
Further Content: You might find this interesting as well
Bank of England. (July 11, 2022). British pound sterling (GBP) to Russian ruble (RUB) monthly exchange rate from July 2015 to February 2022 [Graph]. In Statista. Retrieved May 23, 2024, from https://www.statista.com/statistics/528744/monthly-exchange-rate-gbp-rub-europe/
Bank of England. "British pound sterling (GBP) to Russian ruble (RUB) monthly exchange rate from July 2015 to February 2022." Chart. July 11, 2022. Statista. Accessed May 23, 2024. https://www.statista.com/statistics/528744/monthly-exchange-rate-gbp-rub-europe/
Bank of England. (2022). British pound sterling (GBP) to Russian ruble (RUB) monthly exchange rate from July 2015 to February 2022. Statista. Statista Inc.. Accessed: May 23, 2024. https://www.statista.com/statistics/528744/monthly-exchange-rate-gbp-rub-europe/
Bank of England. "British Pound Sterling (Gbp) to Russian Ruble (Rub) Monthly Exchange Rate from July 2015 to February 2022." Statista, Statista Inc., 11 Jul 2022, https://www.statista.com/statistics/528744/monthly-exchange-rate-gbp-rub-europe/
Bank of England, British pound sterling (GBP) to Russian ruble (RUB) monthly exchange rate from July 2015 to February 2022 Statista, https://www.statista.com/statistics/528744/monthly-exchange-rate-gbp-rub-europe/ (last visited May 23, 2024)
British pound sterling (GBP) to Russian ruble (RUB) monthly exchange rate from July 2015 to February 2022 [Graph], Bank of England, July 11, 2022. [Online]. Available: https://www.statista.com/statistics/528744/monthly-exchange-rate-gbp-rub-europe/