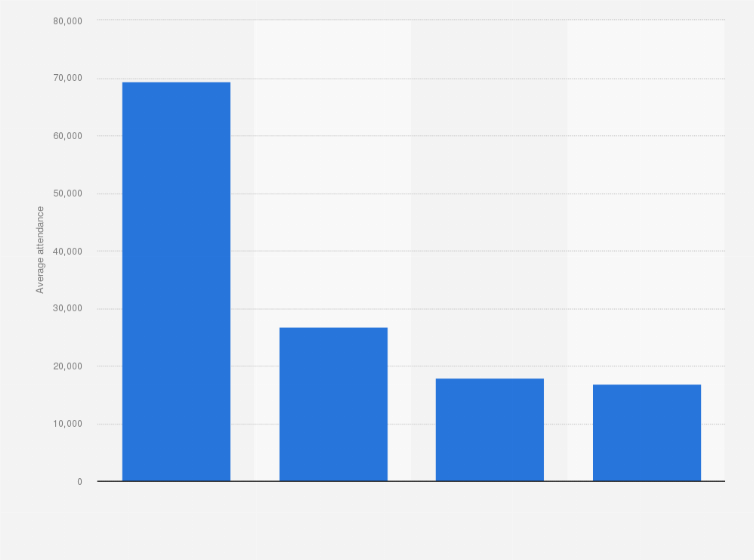
The average regular-season home game attendance in the National Football League (NFL) during the 2022-23 season stood at almost 70 thousand fans. This made it the highest attended professional sports league in North America. By contrast, the average home game attendance in the National Hockey League (NHL) during the 2022-23 season stood at just under 17 thousand. The NFL is a professional football league in the United States that was founded in 1920 as the American Professional Football Association.
Which NFL team has the highest average home game attendance?
In 2022, the Dallas Cowboys recorded an average home attendance of 93,465 spectators, making them the NFL team with the highest average regular season attendance. This figure represents the average number of fans who attended each game held at the team's home stadium during the regular season. While this number is only an average, it provides a good indication of the overall level of support the team received from its fans.
What is the most watched women’s soccer game of all time?
As of May 2023, the highest-attended women's soccer game of all time was Barcelona's home match against Wolfsburg in April 2022. Barcelona’s home semi-final victory against Wolfsburg was watched by a crowd of 91,648 fans, which broke the record set only two months earlier when the women's Clásico drew a crowd of 91,553. Barcelona’s match against Wolfsburg represented the highest-ever attendance for a Women’s Champions League game and, indeed, a women’s soccer game.
Average per game attendance of the four major sports leagues in North America in 2022/2023
Profit from the additional features of your individual account
Currently, you are using a shared account. To use individual functions (e.g., mark statistics as favourites, set
statistic alerts) please log in with your personal account.
If you are an admin, please authenticate by logging in again.
Learn more about how Statista can support your business.
FiveThirtyEight. (February 6, 2023). Average per game attendance of the four major sports leagues in North America in 2022/2023 [Graph]. In Statista. Retrieved December 25, 2024, from https://www.statista.com/statistics/207458/per-game-attendance-of-major-us-sports-leagues/
FiveThirtyEight. "Average per game attendance of the four major sports leagues in North America in 2022/2023." Chart. February 6, 2023. Statista. Accessed December 25, 2024. https://www.statista.com/statistics/207458/per-game-attendance-of-major-us-sports-leagues/
FiveThirtyEight. (2023). Average per game attendance of the four major sports leagues in North America in 2022/2023. Statista. Statista Inc.. Accessed: December 25, 2024. https://www.statista.com/statistics/207458/per-game-attendance-of-major-us-sports-leagues/
FiveThirtyEight. "Average per Game Attendance of The Four Major Sports Leagues in North America in 2022/2023." Statista, Statista Inc., 6 Feb 2023, https://www.statista.com/statistics/207458/per-game-attendance-of-major-us-sports-leagues/
FiveThirtyEight, Average per game attendance of the four major sports leagues in North America in 2022/2023 Statista, https://www.statista.com/statistics/207458/per-game-attendance-of-major-us-sports-leagues/ (last visited December 25, 2024)
Average per game attendance of the four major sports leagues in North America in 2022/2023 [Graph], FiveThirtyEight, February 6, 2023. [Online]. Available: https://www.statista.com/statistics/207458/per-game-attendance-of-major-us-sports-leagues/