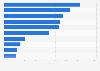
As of 2016, branded generic drugs accounted for 71.1 percent of the total sales in the Philippines' pharmaceutical market. By comparison, segmented originator licensed drugs have accounted for almost a quarter of the total market share and only five percent for unbranded generic drugs.
Share of licensed drugs in the total sales value of the pharmaceutical market in the Philippines from 2007 to 2016, by type
Basic Account
Get to know the platform
You only have access to basic statistics.
This statistic is not included in your account.
Starter Account
The ideal entry-level account for individual users
- Instant access to 1m statistics
- Download in XLS, PDF & PNG format
- Detailed references
$199 USD / Month *
Professional Account
Full access
Business Solutions including all features.
* Prices do not include sales tax.
Other statistics that may interest you Statistics on
About the industry
10
- Premium Statistic Market share corporations pharmaceutical sales value Philippines 2007-2016, by type
- Premium Statistic Sales value of pharmaceuticals Philippines 2018-2024
- Basic Statistic Worldwide prescription drug revenue - market risk from patent expiration 2023-2028
- Basic Statistic Hydrochlorothiazide out of pocket cost U.S. 2004-2021
- Premium Statistic Projected sales at risk due to patent expiry 2014-2023
- Premium Statistic growth in 90 day prescriptions U.S. 2013-2020
- Premium Statistic Share of 90 day prescriptions that are mail or retail dispensed 2013-2020
- Basic Statistic Alprazolam out of pocket cost in the U.S. 2004-2021
- Premium Statistic Number of rosuvastatin prescriptions in the U.S. 2004-2021
- Basic Statistic Rosuvastatin out-of-pocket cost U.S. 2004-2021
About the region
9
- Premium Statistic Average per capita household medical care expenditure Philippines 2012-2015, by type
- Premium Statistic Major source of pharmaceutical products Philippines 2022, by import value
- Premium Statistic Import volume of medicaments Philippines 2018-2022
- Premium Statistic Import value of pharmaceutical products Philippines 2011-2022
- Premium Statistic Export value of pharmaceutical products Philippines 2011-2022
- Premium Statistic Number of pharmaceutical manufacturing companies Philippines 2006 & 2012, by region
- Premium Statistic Number of employees pharmaceutical manufacturing Philippines 2006 & 2012, by region
- Premium Statistic Production workers pharmaceutical manufacturing Philippines 2006 & 2012, by region
- Premium Statistic Major source countries of pharmaceutical products imports Philippines 2022
Selected statistics
5
- Basic Statistic AstraZeneca's revenue from top product Pulmicort 2006-2023
- Premium Statistic Chinese insulin market distribution: leading companies 2011
- Premium Statistic U.S. insulin market distribution: leading companies 2011
- Premium Statistic Expenditure worldwide on diabetes by market 2013-2018
- Premium Statistic Standard Unit medicine use per capita in the U.S. 2007-2011
Other regions
10
- Premium Statistic Teva Pharmaceutical Industries' revenue 2006-2023
- Premium Statistic Share of filgrastim sales attributable to Neupogen or biosimilars US 2015-2018
- Basic Statistic Value share of generic pharmaceuticals market in Turkey 2010-2021
- Basic Statistic Pharmaceutical sales value in Italy 2013-2022
- Basic Statistic Colombia's pharmaceutical market size 2011-2019, by drug category
- Basic Statistic Value of pharmaceutical sales in Czechia 2002-2021
- Premium Statistic Largest domestic pharma companies in Brazil 2015
- Premium Statistic Latin America: brand vs generic medication spend 2014-2018
- Basic Statistic Illinois' medical cannabis sales value U.S. 2018-2024
- Basic Statistic Vermont's medical cannabis sales value U.S. 2018-2024
Related statistics
10
- Premium Statistic Number of retail traders in the pharmaceutical industry Philippines 2012, by region
- Premium Statistic Number of traders in the pharmaceutical industry Philippines 2012, by type
- Premium Statistic Market share of leading pharmaceutical companies Philippines 2016
- Premium Statistic Market share of leading domestic pharmaceutical companies Philippines 2016
- Premium Statistic Market share of leading multinational pharmaceutical companies Philippines 2016
- Premium Statistic Total sales of supermarkets Philippines 2016-2023
- Premium Statistic Total sales of hypermarkets Philippines 2016-2023
- Premium Statistic Major convenience stores Philippines 2022, by retail sales
- Premium Statistic Consumer sales value of ABS-CBN in the Philippines 2014-2020
- Premium Statistic GDP share of pharmaceutical sales Philippines 2018-2024
Further related statistics
9
- Sanofi's total assets 2007-2023
- Pfizer's revenues in the U.S. and abroad 2009-2023
- Merck & Co total assets 2009-2023
- Merck & Co - expenditure on research and development 2006-2023
- Pfizer's ad spending 2006-2023
- Johnson & Johnson's number of employees 2004-2023
- Sales of Johnson & Johnson 2006-2023 by region
- Sales of Johnson & Johnson worldwide 2011-2023, by segment
- CVS Health's total assets 2005-2023
Further Content: You might find this interesting as well
Statistics
- Sanofi's total assets 2007-2023
- Pfizer's revenues in the U.S. and abroad 2009-2023
- Merck & Co total assets 2009-2023
- Merck & Co - expenditure on research and development 2006-2023
- Pfizer's ad spending 2006-2023
- Johnson & Johnson's number of employees 2004-2023
- Sales of Johnson & Johnson 2006-2023 by region
- Sales of Johnson & Johnson worldwide 2011-2023, by segment
- CVS Health's total assets 2005-2023
PCC. (June 8, 2020). Share of licensed drugs in the total sales value of the pharmaceutical market in the Philippines from 2007 to 2016, by type [Graph]. In Statista. Retrieved May 23, 2024, from https://www.statista.com/statistics/1196004/philippines-share-of-licensed-drugs-pharmaceutical-sales-by-type/
PCC. "Share of licensed drugs in the total sales value of the pharmaceutical market in the Philippines from 2007 to 2016, by type." Chart. June 8, 2020. Statista. Accessed May 23, 2024. https://www.statista.com/statistics/1196004/philippines-share-of-licensed-drugs-pharmaceutical-sales-by-type/
PCC. (2020). Share of licensed drugs in the total sales value of the pharmaceutical market in the Philippines from 2007 to 2016, by type. Statista. Statista Inc.. Accessed: May 23, 2024. https://www.statista.com/statistics/1196004/philippines-share-of-licensed-drugs-pharmaceutical-sales-by-type/
PCC. "Share of Licensed Drugs in The Total Sales Value of The Pharmaceutical Market in The Philippines from 2007 to 2016, by Type." Statista, Statista Inc., 8 Jun 2020, https://www.statista.com/statistics/1196004/philippines-share-of-licensed-drugs-pharmaceutical-sales-by-type/
PCC, Share of licensed drugs in the total sales value of the pharmaceutical market in the Philippines from 2007 to 2016, by type Statista, https://www.statista.com/statistics/1196004/philippines-share-of-licensed-drugs-pharmaceutical-sales-by-type/ (last visited May 23, 2024)
Share of licensed drugs in the total sales value of the pharmaceutical market in the Philippines from 2007 to 2016, by type [Graph], PCC, June 8, 2020. [Online]. Available: https://www.statista.com/statistics/1196004/philippines-share-of-licensed-drugs-pharmaceutical-sales-by-type/