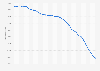
In New Zealand in April 2020, the average revenue per paying user with carrier billing was 4.1 U.S. dollars, a reduction from the previous month. A year earlier in April 2019, the average revenue was 13.6 U.S. dollars.
Average revenue per paying user with carrier billing in New Zealand from April 2019 to April 2020 (in U.S. dollars)
Basic Account
Get to know the platform
You only have access to basic statistics.
This statistic is not included in your account.
Starter Account
The ideal entry-level account for individual users
- Instant access to 1m statistics
- Download in XLS, PDF & PNG format
- Detailed references
$199 USD / Month *
Professional Account
Full access
Business Solutions including all features.
* Prices do not include sales tax.
Other statistics that may interest you Statistics on
About the industry
10
- Premium Statistic Median carrier billing transaction value New Zealand 2019-2020
- Premium Statistic Median revenue per paying user with carrier billing New Zealand 2019-2020
- Premium Statistic Average carrier billing transaction value New Zealand 2019-2020
- Premium Statistic Average carrier billing transaction value in Sweden 2019-2021
- Premium Statistic Average carrier billing transaction value in Mexico 2019-2021
- Basic Statistic Average carrier billing transaction value in Canada 2019-2021
- Premium Statistic Average carrier billing transaction value in Brazil 2019-2021
- Premium Statistic Average carrier billing transaction value Colombia 2019-2021
- Premium Statistic Average monthly carrier billing transaction value in South Korea 2020-2021
- Premium Statistic Average monthly carrier billing transaction value in Taiwan 2020-2021
About the region
6
- Premium Statistic Paymark transactions in Easter New Zealand 2019 by region
- Premium Statistic New Zealand: smartphone activities 2015
- Premium Statistic New Zealand: second screen device usage 2016
- Premium Statistic New Zealand: device used for online purchase 2015
- Premium Statistic New Zealand: recent purchase channels 2015
- Premium Statistic New Zealand: purchase channels after in-store research 2014
Other regions
9
- Basic Statistic Average carrier billing transaction value in Denmark 2019-2021
- Premium Statistic Average monthly carrier billing transaction value in Kuwait 2020-2021
- Basic Statistic Average carrier billing transaction value in Finland 2019-2021
- Premium Statistic Median monthly average revenue per user with carrier billing Thailand 2019-2020
- Basic Statistic Mexico median carrier billing transaction value 2019-2020
- Basic Statistic Canada median carrier billing transaction value 2019-2020
- Premium Statistic Average monthly carrier billing transaction value in Iraq 2020-2021
- Premium Statistic Average monthly carrier billing transaction value in Saudi Arabia 2020-2021
- Premium Statistic Average monthly revenue per user with carrier billing in Oman 2019-2020
Related statistics
10
- Premium Statistic Use of online payment platforms in last year Australia 2018 by age
- Premium Statistic Use of digital payment methods in last year Australia 2019, by type
- Premium Statistic Use of digital payment methods in last year Australia 2019, by gender
- Premium Statistic Australians using digital payment methods in last year Australia 2018 by type
- Premium Statistic Use of digital payment methods in last year Australia 2018 by age
- Premium Statistic Use of contactless or cardless mobile payments in last year Australia 2018 by age
- Premium Statistic Use of banks' own mobile payments in last year Australia 2018 by age
- Premium Statistic Value of card payments Australia FY 2014-2023, by type
- Premium Statistic Number of card payments made Australia FY 2014-2023, by type
- Premium Statistic Type of websites or apps consumers purchase online Australia 2015
Further related statistics
5
Further Content: You might find this interesting as well
Statistics
Fortumo. (May 28, 2020). Average revenue per paying user with carrier billing in New Zealand from April 2019 to April 2020 (in U.S. dollars) [Graph]. In Statista. Retrieved May 21, 2024, from https://www.statista.com/statistics/1122077/new-zealand-carrier-billing-transaction-average-revenue-per-user/
Fortumo. "Average revenue per paying user with carrier billing in New Zealand from April 2019 to April 2020 (in U.S. dollars)." Chart. May 28, 2020. Statista. Accessed May 21, 2024. https://www.statista.com/statistics/1122077/new-zealand-carrier-billing-transaction-average-revenue-per-user/
Fortumo. (2020). Average revenue per paying user with carrier billing in New Zealand from April 2019 to April 2020 (in U.S. dollars). Statista. Statista Inc.. Accessed: May 21, 2024. https://www.statista.com/statistics/1122077/new-zealand-carrier-billing-transaction-average-revenue-per-user/
Fortumo. "Average Revenue per Paying User with Carrier Billing in New Zealand from April 2019 to April 2020 (in U.S. Dollars)." Statista, Statista Inc., 28 May 2020, https://www.statista.com/statistics/1122077/new-zealand-carrier-billing-transaction-average-revenue-per-user/
Fortumo, Average revenue per paying user with carrier billing in New Zealand from April 2019 to April 2020 (in U.S. dollars) Statista, https://www.statista.com/statistics/1122077/new-zealand-carrier-billing-transaction-average-revenue-per-user/ (last visited May 21, 2024)
Average revenue per paying user with carrier billing in New Zealand from April 2019 to April 2020 (in U.S. dollars) [Graph], Fortumo, May 28, 2020. [Online]. Available: https://www.statista.com/statistics/1122077/new-zealand-carrier-billing-transaction-average-revenue-per-user/