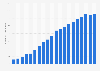
In 2021, the net sales of Apple Inc. in the Asia-Pacific region amounted to approximately 26.36 billion U.S. dollars. This was an increase from 2020, in which the net sales of Apple Inc. for the whole year in the Asia-Pacific region reached approximately 19.59 billion U.S. dollars.
Net sales of Apple Inc. in the Asia-Pacific region excluding Greater China and Japan from 2013 to 2021 (in billion U.S. dollars)
Basic Account
Get to know the platform
You only have access to basic statistics.
This statistic is not included in your account.
Starter Account
The ideal entry-level account for individual users
- Instant access to 1m statistics
- Download in XLS, PDF & PNG format
- Detailed references
$199 USD / Month *
Professional Account
Full access
Business Solutions including all features.
* Prices do not include sales tax.
Other statistics that may interest you Statistics on
About the industry
10
- Premium Statistic Apple Inc: operating income APAC 2013-2021
- Premium Statistic U.S. opinion on technology companies 2019, by age group
- Basic Statistic U.S. opinion on government regulation of technology companies 2019, by education
- Basic Statistic U.S. opinion on government regulation of technology companies 2019 by ethnicity
- Basic Statistic U.S. opinion on government regulation of technology companies 2019 by gender
- Basic Statistic U.S. opinion on government regulation of technology companies 2019, by age
- Basic Statistic U.S. opinion on government regulation of technology companies 2019
- Basic Statistic U.S. opinion on technology companies 2019, by education
- Basic Statistic U.S. opinion on technology companies 2019
- Basic Statistic U.S. opinion on technology companies 2019, by gender
About the region
10
- Premium Statistic High technology exports APAC 2019, by country
- Premium Statistic Profitability of investments in tech APAC 2020, by country
- Premium Statistic Major tech startups APAC 2020, by funding
- Premium Statistic Spending on public cloud services APAC 2019-2020
- Premium Statistic Distribution of smart wearable band shipments APAC Q3 2019 by brand
- Premium Statistic Growth of smart wearable band shipments APAC Q3 2019 by country
- Premium Statistic Spending on public cloud services APAC 2019, by country
- Premium Statistic Spending on tech goods and services Asia 2019, by country
- Premium Statistic ICT service exports APAC 2017 by country or region
- Premium Statistic Spending forecast on robotics APAC 2016-2022
Other regions
10
- Basic Statistic U.S. opinion on technology companies 2019, by ethnicity
- Premium Statistic Leading IT services brands in India 2023 by brand value
- Premium Statistic Total proceeds of tech IPOs worldwide Q1 2016 - Q4 2017
- Premium Statistic Largest ICT companies in Finland 2018, by revenue
- Premium Statistic London Stock Exchange (UK): technology companies listed 2018-2023
- Premium Statistic SK Communications operating revenue 2012-2022
- Premium Statistic Revenue of KONGSBERG 2009-2019
- Premium Statistic Most funded startups in the Nordic countries 2016
- Premium Statistic Startup funding in the Nordic countries 2012-2016
- Premium Statistic Average consumer spending on household appliances and technology Spain 2016-2018
Related statistics
10
- Premium Statistic Samsung: sales value in Asia and Africa 2012-2020
- Premium Statistic Asia-Pacific breakdown of robotics market 2016, by use case
- Premium Statistic Growth of GDP from livestock and fishery sector Myanmar FY 2011-2020
- Premium Statistic GDP contribution Myanmar 2019, by sector
- Premium Statistic Share of GDP contribution from total agriculture sector Myanmar FY 2010-2019
- Premium Statistic Growth of GDP contribution from agriculture sector Myanmar FY 2011-2020
- Premium Statistic Growth of GDP contribution from forestry sector Myanmar FY 2011-2020
- Premium Statistic Major digital media and entertainment companies APAC 2021, by market cap
- Premium Statistic Major tech unicorns SEA 2021, by funds raised
- Premium Statistic Fastest growing tech companies APAC 2020, by growth rate
Further related statistics
10
- Net interest income of Deutsche Bank 2006-2023
- Net revenue from investment banking at Goldman Sachs 2009-2023
- Flowers Foods: sales share in the U.S. 2021 & 2022, by segment
- Flowers Foods: sales in the U.S. 2010-2023
- Flowers Foods: U.S. sales 2021-2022, by retail segment
- Hormel Foods' net sales worldwide 2012-2023
- Senior chief financial officer salary per annum in Switzerland 2023
- Total sales of the Richemont Group worldwide 2008-2023
- Net sales of GameStop worldwide 2010-2022, by region
- Global net sales of Monster Beverage 2008-2022
Further Content: You might find this interesting as well
Statistics
- Net interest income of Deutsche Bank 2006-2023
- Net revenue from investment banking at Goldman Sachs 2009-2023
- Flowers Foods: sales share in the U.S. 2021 & 2022, by segment
- Flowers Foods: sales in the U.S. 2010-2023
- Flowers Foods: U.S. sales 2021-2022, by retail segment
- Hormel Foods' net sales worldwide 2012-2023
- Senior chief financial officer salary per annum in Switzerland 2023
- Total sales of the Richemont Group worldwide 2008-2023
- Net sales of GameStop worldwide 2010-2022, by region
- Global net sales of Monster Beverage 2008-2022
Apple. (October 28, 2021). Net sales of Apple Inc. in the Asia-Pacific region excluding Greater China and Japan from 2013 to 2021 (in billion U.S. dollars) [Graph]. In Statista. Retrieved May 21, 2024, from https://www.statista.com/statistics/1037199/apac-annual-net-sales-apple-inc/
Apple. "Net sales of Apple Inc. in the Asia-Pacific region excluding Greater China and Japan from 2013 to 2021 (in billion U.S. dollars)." Chart. October 28, 2021. Statista. Accessed May 21, 2024. https://www.statista.com/statistics/1037199/apac-annual-net-sales-apple-inc/
Apple. (2021). Net sales of Apple Inc. in the Asia-Pacific region excluding Greater China and Japan from 2013 to 2021 (in billion U.S. dollars). Statista. Statista Inc.. Accessed: May 21, 2024. https://www.statista.com/statistics/1037199/apac-annual-net-sales-apple-inc/
Apple. "Net Sales of Apple Inc. in The Asia-pacific Region excluding Greater China and Japan from 2013 to 2021 (in Billion U.S. Dollars)." Statista, Statista Inc., 28 Oct 2021, https://www.statista.com/statistics/1037199/apac-annual-net-sales-apple-inc/
Apple, Net sales of Apple Inc. in the Asia-Pacific region excluding Greater China and Japan from 2013 to 2021 (in billion U.S. dollars) Statista, https://www.statista.com/statistics/1037199/apac-annual-net-sales-apple-inc/ (last visited May 21, 2024)
Net sales of Apple Inc. in the Asia-Pacific region excluding Greater China and Japan from 2013 to 2021 (in billion U.S. dollars) [Graph], Apple, October 28, 2021. [Online]. Available: https://www.statista.com/statistics/1037199/apac-annual-net-sales-apple-inc/